Introduction
Increased financial globalization and its negative effects have renewed the debate around the incidence of monetary variables in stock markets co-movements. Concurrently, the rising sensitivity of stock markets’ co-movements due to financial and economic innovations has heightened concerns about identifying which financial variables explain changes in the international dependence on stock markets and financial contagion.
Current financial literature research has acknowledged that monetary variables, such as exchange rate and interest rate, impact financial contagion and dependence. However, most studies have focused on changes on these phenomena during crises periods, particularly during the Great Recession of 2008-2011 and its sequel to the Eurozone and the world markets in general.
Empirical studies have unveiled an important relationship between portfolio investments and monetary variables. During the recent crises (subprime, sovereign debt, global financial, COVID-19) changes in risk free rates triggered important downturns in stock indexes, instability periods and currency depreciations which led to increased levels of dependence and co- movements between stock markets. Representative research on this area includes those by Chiang, Jeon and Li (2007), Kenourgios et al. (2011), Syllignakis and Kouretas (2011), Cho and Choi (2015), Cevik and Ozturkkal (2020), Glover et al. (2020), Ortmans and Tripier (2020), and Ben Amar et al. (2021). Frequently, those studies have concluded that contagion expands during episodes of extreme economic and financial distress. Moreover, research dealing with co-movements between stock markets have stressed increased correlations.
However, this approach has been criticized. Forbes and Rigobon (2002), Loretan and English (2000), and Boyer et al. (1997) demonstrate that the conventional correlation is biased and inaccurate to model financial relationships because the stylized facts of financial series (such as heteroskedasticity, fat tails, clustered volatility, long memory, and asymmetry). Thus, the correlation coefficient may lead to spurious results (Forbes & Rigobon, 2002; Baur, 2003).
To overcome this problem, we propose a methodology based on copula theory which yields more consistent estimations about the behavior of financial series. Notably, due to Archimedean copulas properties, several studies have used them to test contagion effect: Rodriguez (2007), Kenourgios et al. (2011), Aloui et al. (2011), Maneejuk and Yamaka (2019), Mohti et al. (2019), to mention a few of them.
Among studies which have analyzed the U.S. stock market relationships employing the copula approach are those developed by Chen et al. (2014), Aloui et al. (2011), Tachibana (2018), and Gong et al. (2020). Chen et al. (2014) examined the contagion effect between the U.S. and Chinese stock markets during the recent financial crisis by combining multifractal volatility and the copula approach. Their evidence suggests that the statistical characteristics of Kendall’s τ during crisis and non-crisis periods are different; the contagion effect increased about 87.39% on average during a crisis period. Similarly, Aloui et al. (2011) analyzed the conditional dependence structure between the U.S. and BRIC stock markets using a GARCH-Copula approach. They found strong evidence of time-varying dependence between each BRIC market and the U.S. market. Finally, Tachibana (2018) applies a vine copula approach to analyze co-movements between currency and the stock markets of 22 countries and the U.S. stock market. Results indicate that both stock and currency markets in these economies are highly correlated with the U.S. stock market during the crisis period of 2007-2012.
More recently, Mohti (2019), applied copula models to examine contagion from the USA subprime financial crisis on a large sample of frontier stock markets before and after the crisis. Kendall’s τ and the Spearman’s ρ were used to gauge the presence1. Their evidence reveals significant evidence of contagion in the European region, mainly with the markets of Croatia and Romania. Other frontier markets in the sample seemingly remained. Similarly, BenMin and BenSaïda (2019) employ a regular vine copula model to examine dependence dynamics between major American and European stock markets, both during crisis periods and tranquility periods. Their evidence shows meaningful changes in connectedness and shock transmissions during the two periods analyzed; this is robust evidence of financial contagion between these two markets.
Neural networks are being widely used in economics and financial applications.2 The literature suggests numerous advantages that artificial neural networks (ANN) have over statistical methods. Among these advantages must ANN’s capacity to learn be mentioned along with better model non-linear and complex relationships; also, after learning from the original initial inputs and their relationships, artificial neural networks can derive unseen relationships, even from unseen data. Finally, ANN does not impose restrictions on the input variables concerning, for example, the distribution of the series (Mahanta, 2017).
In terms of our object of study, it is important to stress that the U.S. economy and markets have a key role in the global financial architecture. According to the International Monetary Fund (n. d.), the American GDP (Gross Domestic Product) represented 25% of the world GDP and the U.S. economy accounted for 21% and received 14% of total portfolio investments in 2007. This partially explains the subprime crisis magnitude and its importance since the financial episode was centered on the U.S. housing market. This crisis caused widespread banking failures, massive downturns in asset markets, and eventually a worldwide recession. It is therefore of utmost importance to examine the relationship between the U.S. stock market and the world stock markets.
However, a simple relationship among the stock markets’ indexed activities and co-movements is limited. We undertake a thorough view assessing which are the variables that explain changes in stock market dependence. Related studies include Poshakwale and Mandal (2017), who study economic and non-economic sources of stock return comovements of the Indian, U.S., UK, German, French, Canadian, and Japanese stock markets. Findings show that international interest rates, inflation uncertainty, and dividend yields are the main drivers of the asymmetric return co-movements. Ahmed et al. (2017) examine the importance of economic fundamentals in the transmission of international shocks to financial markets in emerging markets. The evidence shows that differences in economic fundamentals appeared to play a role in explaining the heterogeneous financial market responses during the global financial crisis of 2008, and the role of fundamentals appeared to progressively increase through the European crisis in 2011 and, subsequently, the 2013 taper tantrum.
Following these lines of research, this paper examines stock return comovements (dynamic dependence) between the U.S. (S&P 500) and the World (MSCIW) markets during the period from 2000-2016, which includes episodes of financial calm and turmoil.3 Once dynamic dependence is estimated, we analyze if monetary variables (long and short-term interest rates, interest rates spread and exchange rates4) explain changes in this relationship. Dependence is estimated employing a Dynamic Copula Approach. Additionally, we apply ANN analysis to determine whether monetary variables describe the dynamic relationship between the U.S. equity market and the global stock market.
Summing up, this research contributes to the financial literature in two ways. First, it proposes a relatively innovative and complementary methodology which overcomes the limitations of traditional approaches. Our twofold 1) the approach allows us to capture non-linearity, non-normality, skewness, and dynamic behavior in financial series. Additionally, 2) this article sheds some light on the nature of dynamic dependence between the U.S. and the world stock markets and on the incidence and importance of key monetary variables in this relationship of dependence, above all, during the recent COVID-19 crisis and in the face of the coordinated response of different governments and monetary authorities. The empirical evidence is of outmost importance in terms of monetary policy, asset allocation, risk management, and the creation of investment strategies.
The rest of this paper is organized as follows: Section II explains the methodology; Section III describes the data and presents the main empirical analysis and results; and conclusions follow in Section IV.
I. Methodology
Concretely, to estimate the time-varying relationship between the U.S stock market and the world stock market, this paper introduces a relatively innovative approach. First, an Archimedean Copula function is employed to measure the dependence. Dynamic behavior is incorporated through a rolling window calculation; dependence is measured daily, using windows with 251 days (about 8 months), according to the average business days of the year. This allows us to capture dynamic dependence.
Once the dynamic dependence series is generated, Artificial Neural Network Analysis is employed to test whether monetary variables determine changes in dynamic dependence. In other words, the monetary factors which drive contagion or interdependence effects between the U.S. stock market and the global stock market are calculated.
A. Econometric Modeling
Definition 1.1. A function C: [0, 1] n → [0, 1] is a n-copula if it fulfills the following features:
-
∀ u ∈ [0, 1], C (1, . . ., 1, u, 1, . . ., 1) = u
-
∀ u i ∈ [0, 1] , C (u 1 , . . . , u n ) = 0 if at least one of the u ′ is is equal to zero.
-
C is defined, and n-growing (i.e., the C-volume of each box which vertices are in [0, 1] n ) is positive.
A Copula is a multivariate distribution in the interval [0, 1] n with uniform margins. In this case the Copula is the multivariate distribution function with a transformation to a univariate marginal (Korbicz, et al. 2020).
Definition 1.2. Sklar’s Theorem (1959). Let F be a n-dimensional distribution function with continuous marginals F 1 , . . ., F n , there is a unique n-copula C: [0, 1] n → [0, 1] such that

The copula combines marginals to form a multivariate distribution. This theorem provides a parametrization for the multivariate distribution. Given a F distribution with multivariate marginals F 1 , . . ., F n , the function

is a n-copula. This is the copula of the multivariate distribution F.
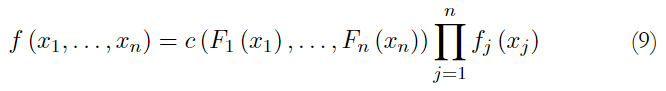
According the Sklar theorem, the n-dimensional density f can be represented as follows:

where c is the density of copula C. This result allows the selection of different margins and the dependence structure given by the copula to be used in the construction of a multivariate distribution. This contrasts with the usual procedure to generate a multivariate distribution because the restriction on the margins are usually of the same type (Zhi, Wang & Xu, 2021).
Sklar theorem allows us to derive a copula for each multivariate distribution function. Despite the fact that there are many types of copulas, just some families are commonly used; among these families are the Archimedean copulas used in this paper.
Archimedean copula is chosen because of its advantages and bene- fits. Archimedean copulas allow modeling dependence in arbitrarily high di- mensions with only one parameter, governing the strength of dependence (Grover, 2015). It is considered an advantage, as there are other approaches which provide a large number of parameters, making the analysis difficult. Among the Archimedean copulas, we estimate the Clayton copula because of its adequacy to describe negative skewness, which is an important feature of stock market return series (Nelsen, 1999).
As previously mentioned, closely following a previous paper by Sosa et al. (2015), our Copula approach applies rolling window estimation, using 251-day windows (about 8 months) according to the average business days of the year.
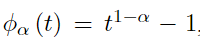
Definition 1.3 Archimedean Copula. A Bivariate distribution of this copula family can be represented as follows:

where ϕ α is convex and decreasing such as ϕ α 0. Function ϕ α is the generator of copula C α and ϕ − α 1 is the inverse of the generator, named Laplace transformed of a latent variable γ, which induces dependence α. The selection of a generator gives as a result different types of Archimedean copula. In this document Clayton copula is employed (Yaméogo & Barro, 2021).
Definition 1.4 Clayton Copula. The bivariate copula belonging to Clayton copula is defined as

with its generator
 , and Laplace transformed ϕ−1
α (s) =
, and Laplace transformed ϕ−1
α (s) =

B. Dependence measure via copulas
Each of the multiple copula families is characterized by a parameter or parameter vector. This parameter measures the dependence among margins and is called dependence parameter θ. In this case, bivariate copulas are estimated with a dependence parameter θ. There is a relation between the dependence parameter and the concordance measure Tau de Kendall, which is addressed in the following section (Fenech & Vosgha, 2019).
Let X 1 and X 2 be two random variables with marginals continuous distribution functions F 1 and F 2 and joint distribution function F. The traditional concept of dependence, Kendall’s τ , could be represented in terms of copula F. Kendall’s τ is given by
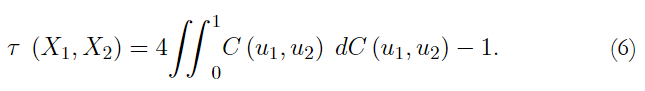
The Kendall’s τ is in function of the X 1 and X 2 copulas. In this study, there is a special interest in the Kendall rank correlation τ.
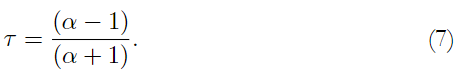
To sum up, if (X 1 , X 2) have a bivariate Archimedean copula and arbitrary continuous marginals, the Kendall’s τ is
C. Copula parameters estimation
There are several methodologies for estimating the parameters associated with copula. This paper employs maximum likelihood. Copula parameters can be obtained by maximizing its log-likelihood function, as explained below:
Let C be a copula, such that,

with density function,
Therefore, the maximum likelihood estimation mechanism can be defined as follows:
Let C be X an r.v.i.i.d. vector with multivariate distribution function F and continuous marginal distribution function F 1 , . . ., F n ; the log-likelihood function is defined below:
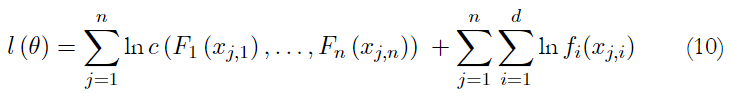
where θ are the parameters for both marginal set and copula. Thus, given the marginal set and a copula, the log-likelihood function can be maximized obtaining the maximum likelihood estimator (Sosa et al., 2021).
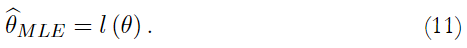
D. Dynamic copula estimation
To analyze how the dependence between the U.S. and the world stock markets evolves during the period of study, a rolling window approach is proposed. Figure 1 shows this estimation process. For each 251 days (trading days in one year, approximately), a copula parameter is estimated. Once the first parameter is obtained (1 st window, from Day 1 to Day 251), the window is moved one day, capturing the following day’s information. In this sense, the dependence measure, approached by a rolling window, allows us to analyze daily changes in the relationship between the two equity markets under study.
E. Artificial Neural Network
A neural network represents an important class of non-linear approximation and classification models (Fischer, 2015); it is an information processing paradigm inspired by biological nervous systems such as the brain to process information (Nunes da Silva et al., 2017). It is composed of many elementary computational units (neurons) working in unison to solve specific problems (Coakley & Brown, 2000; Maind & Wankar, 2014). Neural networks learn through experience, generalize from previous knowledge, and can make decisions.
The most common neural network consists of three types of layers: input layers, hidden layers, and output layers. There are various types of neural networks; for insatance, multilayer perceptron (MLP)5 is a neural network with one or more hidden layers. MLP is a feedforward Network, which means that it reacts to environmental changes to keep a certain state in the system. An MLP network allows the analysis of more complex patterns (Tsai & Wu, 2008). In multilayer networks, the predicted outputs for each training are estimated, and then it is calculated the difference between the target and the predicted value. Thus, error is reduced by the algorithm training (Tsai & Wu, 2008).
The input layer is integrated by neurons which receive data from the environment. The hidden layers do not have a direct connection with the environment but receive data and information from the input layer. This layer is where the environment characteristics are estimated, modeled, and represented. Finally, the output layer provides the network result.
F. ANN Training Process
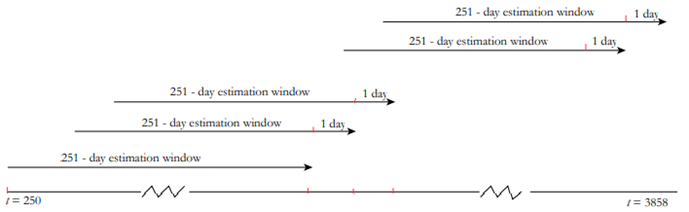
The ANN training process consists of modeling the hidden layers to represent the functional forms with data obtained in the input layer. Training is executed on a sub-sample D= (X (n) , t (n) ), W (weights) are adjusted on the input function, to minimize the error function, through the gradient descent method (Manurung et al., 2020).
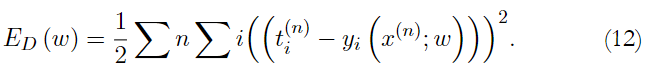
Minimization is based on continuous evaluation of the gradient E D with the chain rule, following the next steps:
1. Synaptic weights and initial thresholds are established
2. Bases are executed to obtain a network answer in front of the r pattern
3. Those signs are interpreted as error signals associated to this process; these errors are estimated as
4. The total increment for every pattern, of thresholds and weights ∆W′kj and ∆W′ji, is estimated.
5. Weights and thresholds are updated.
6. The total error is estimated again in t + 1. If this error is not satisfactory, in other words, if this error is different to the minimum absolute found by the gradient descent, it is interpreted as an error signal in the process and Step 3 is repeated until the minimal error is found.
In addition, for each of the hidden layers and output layers, an activation function is estimated by an algorithm. The activation function relates the weighted sum of layer units with unit values of the correct layer. This activation function is different for hidden layers and output layers (Liu, et al. 2019).
For hidden layers, the types of functions are: 1) the log-sigmoid form,
 and 2) the hyperbolic tangent tanh activation function
 The activation functions for output layers are identity = f (a) = a and softmax =
f (a)
The activation functions for output layers are identity = f (a) = a and softmax =
f (a)

When the function has minimized the errors and found the activation functions, the process is concluded. To test the model, a separate sample is used to contrast predicting outputs with target outputs.
It is important to mention that the ANN separates data in three different subsets: training, testing, and reserve subsamples. The training subsample is used to run the model in the hidden layer, the testing subsample allows us to confirm the adequate learning process in terms of minimizing the function error, and the reserve subset is not considered in the two previous subsets; it is employed to verify the closeness between the estimated data by the ANN and real data to reduce bias in estimation (Paule-Vianez, et al., 2019).
II. Empirical Evidence
A. Data
To estimate time-varying dependence between the U.S. and world stock returns, we employ daily closing data of Standard & Poor’s 500 Index and the Morgan Stanley Capital International World Index (MSCIW), from January 2000 to June 2016. Once the dynamic dependence is estimated, it is used as the dependent variable; and the explanatory variables are the following: 3-month US Treasury bill rate (domestic short-term rate), 3-month LIBOR (foreign short-term rate), 10-year Treasury bond (domestic long-term rate), UK 10-year bond yield (foreign long-term rate), 30-year U.S. rate (domestic long-term rate), UK 30-year bond yield (foreign long-term rate), Euro/US Dollar and UK Pound/US Dollar (exchange rate), UK 10-year bond yield- 10-year Treasury bond (long-term rate foreign-domestic spread), 3-month LIBOR-3-month T-bills (short-term rate foreign-domestic spread), 10-year Treasury bond-3 months T-bills (long and short-term domestic spread), UK 10-year bond yield-3 months LIBOR (long and short-term foreign spread). Interest rates are modeled as change rate and prices (exchange rate and indexes) as price returns.
B. Graphic analysis
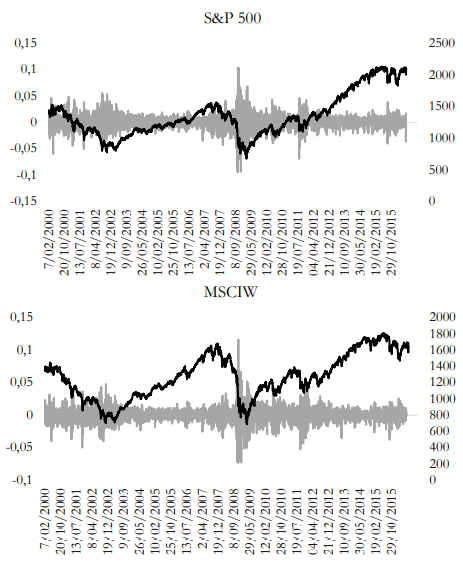
Figure 1 summarizes the behavior of both the U.S. stock prices and returns and the world prices and stock returns. MSCI and S&P 500 experienced two important downturns in 2003 and 2008. These events could be related to the announcement of the Iraq invasion in 2003 and the beginning of the global financial crisis. The return series seems to show volatility clusters and asymmetry in 2001-2003, 2007-2009, 2011-2012, 2014-2015. All these represented financial turmoil episodes: the dot com, subprime, and sovereign debt crises. In this sense, apparently, the series presented similar behavior during instability periods, above all from 2007 to 2012. Dynamic copula analysis, applied in the following section, allows checking how alike the behaviors of two series are and whether there was contagion or interdependence between them.
Table 1 shows that the American stock market on average is more profitable and volatile than the global stock market. Both series are negatively skewed and show excessive kurtosis, which means their distribution is characterized by heavy tails and sharp peaks. The Jarque-Bera test reinforces the idea that series are not normally distributed. These features are consistent with the dynamic copula methodology proposed.
Table 1
Descriptive Statistics
C. Dynamic copula estimation
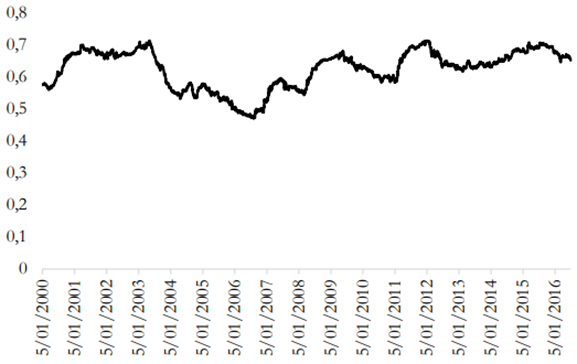
As previously mentioned, to analyze dynamic dependence between the American and world share markets from January 2000 to June 2016, the dynamic copula approach is applied; results are shown in Figure 3. Copula estimation confirms that there is a high dependence during the whole period; it is on average 0.62, reaching levels around 0.7 during long periods. According to McCluskey and Lalkhen (2007), a coefficient level of 0.7 shows high correlation between variables. This finding is consistent with interdependence term, which is defined as a high level of correlation between two markets across time; it suggests strong linkages between two markets (Forbes & Rigobon, 2002) and can be explained due to the importance of the financial and economic activity of the U.S. in the world and because several relationships that this economy keeps with the rest of the countries, for example, through capital flows.
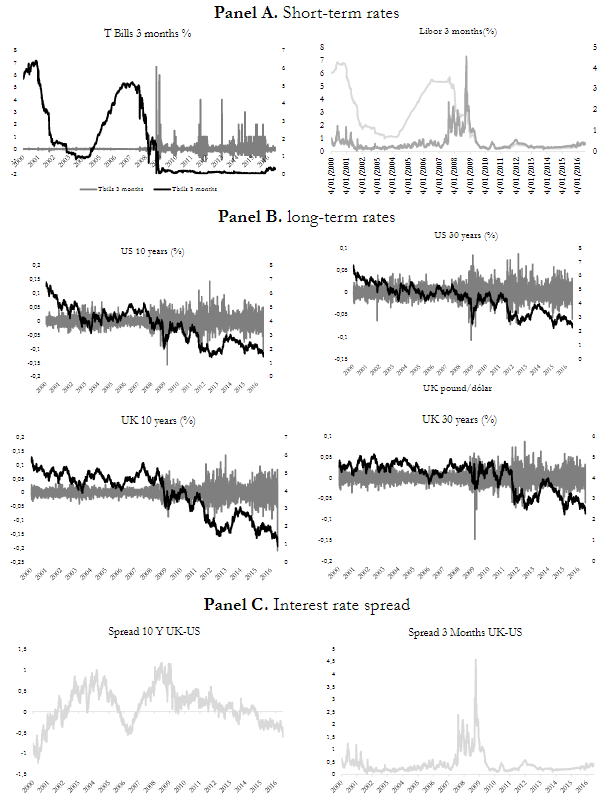
Once dynamic dependence is estimated, monetary variables are analyzed in Figure 4. It can be observed that 3-month T-bills and 3-month LIBOR rates exhibit a common behavior; it seems that LIBOR rate is a following indicator of T-bills. Both rates decreased from 2000-2004; the U.S. funds rate reached 1% level in 2003, the lowest in 45 years. Between 2004 and 2006, the Federal Reserve Board raised interest rates 17 times, increasing them from 1 percent to 5.25 percent (Bianco, 2008). Finally, because of Quantitative Easing programs, the Federal Reserve and the Bank of England reduced the interest rate since 2008 with the purpose of alleviating financial market distress (Fawley & Neely, 2013).
Short-term rate is a key economic and financial indicator, not just for the American economy, but for the rest of the world. U.S. monetary authorities manipulated this variable to attenuate instability and restart the economic activity.
Long-term rates (10 years and 30 years) present a negative trend during the whole period; it may be explained by a monetary policy decision to stimulate economic activity. It is important to mention that these economic indicators have presented higher volatility since 2008.
Panel C shows the interest rate spread between the U.K. and the U.S., of long and short terms. The 10-year spread presented an important growth from 2000 to 2004, probably because of the FED lowered funds rate; from August 2004 to January 2006, it exhibited a negative trend which reverted, reaching the highest level in August 2008. This indicator is stabilized and diminished less abruptly than in previous episodes (2008-2016).
In the 3-month spread, it can be observed that there are important changes during the dot com crisis period, above all, from August 2007 to July 2009. Changes in short-term rate spread can be explained because of the dramatic cuts to the Federal Reserve funds rate in comparison with the U. K. funds rate.
In Panel D, it can be observed that the long short-term rate spreads for the U.S. and the U. K. Both figures reflect similar change although UK rate changes are softer than U.S. variations. Similar to the 10-year spread (Panel C), the long short-term spreads presented an important fall associated with unconventional monetary policy application; the spread tended to zero from 2005 to 2007.
Panel E shows exchange rate evolution; the Euro/US Dollar rate indicator is more volatile than the Pound/US Dollar indicator. The highest variations in Pound/USD were in September 2004, June 2006, October 2008, and June 2016. Variations of 2004 and 2006 may be related to abrupt changes in the U.S. reference rate. October 2008 shift could be associated with Lehman Brothers bankruptcy, and June 2016 could be explained through the beginning of Brexit, when U.K. voters chose to leave the European Union.
D. Neural Network results
Following the dynamic copula estimation,6 we apply a neural network i) to prove whether monetary variables can explain changes in dependence between the U.S. and world stock markets returns and ii) to know which of the variables under analysis are more important to describe co-movements between the American and Global stock markets.
The dependent variable is the dependence (measure via Copula Approach), and the explanatory variables are the following: short-term rates (3-month LIBOR and T-bills), long-term rates (10 and 30 years U.K. and U.S.), spread between LIBOR and T-bills short-term rates (3-month), spread between U.K. and U.S. long-term rates (10-year), spread between long and short-term rates in the U.S. (10-year-3 month U.S.), spread between long and short-term rates in the U.K. (10-year-3-month U.K.), and exchange rates (Euro/USD and Pound/USD).
Table 2 summarizes the network information; the left side shows the sample distribution: 72.3% is used to train the ANN, 20.8% is employed to test the network, and 6.9% is the reserve. On the right-side the ANN results and characteristics are presented. As previously mentioned, the multilayer perception model has one dependent variable (dynamic dependence) and 12 explanatory variables (monetary variables). There are eight units in the hidden layer, and its activation function is hyperbolic tangent. In the output layer, the change of scale method is standardized, the activation function is identity, and the error function is the square sum.
Table 2
ANN Information
Testing the model means to know how good the model is to forecast values with provided information; a separate sample is used to contrast predicting outputs with target outputs. Figure 5 shows the results of this test; the estimated values are compared with the real outputs “copula”, which are the dependence values estimated by the dependence measure. In the dispersion graph (left side), if the estimated and the real values were equal, this would be represented by a 45 ◦ line. The comparison shows that the target and estimated outputs are not the same, but they are very similar. The line graph (right-side) reinforces this finding, the gray line represents the estimated output and the black one the real value; the difference is almost imperceptible
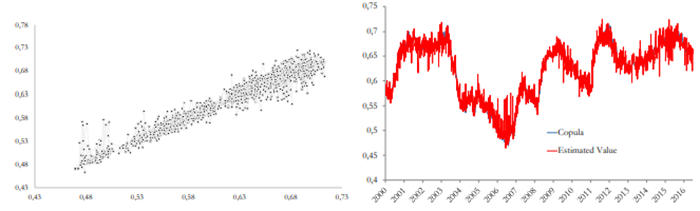
It can be observed that the difference between the predicting and the target outputs is not significant. This appreciation is complemented with the estimation of the average error, which is 0.049%7 and the Mean Absolute Error (MAE), which is on average 0.014%.8 This evidence shows that monetary variables are suitable to explain changes in dependence and, hence, to predict movements in this financial relationship.
ANN approach, contrary to econometric models, does not allow to observe what occurs inside of hidden layers, in terms of the coefficients obtained. However, ANN models allow the procurement of information related to the importance of the impact of independent variables on the dependent one. This analysis is known as the importance analysis of the variables9.
In this sense, once it is proved that monetary variables describe variations in American and global stock markets co-movements, we analyze what the most important monetary variables in this process are. To reach that purpose, the importance of the variable analysis is employed;10 This variable measures how much the predicted value changes for different values of each of the independent variables.
Table 3 presents the results of normalized importance analysis. It shows that the short-term spread between 3-month LIBOR rate and 3-month Treasury bill rate (3M LIBOR-T-bills) is the most important factor that explains changes in dynamic dependence between the American and the global stock market. The short-term spread is considered an extremely important variable due to its systematic nature; it influences the expected returns of the rest of the assets of a given economy. In addition, changes in government bond yields have an impact on asset allocation, generating portfolio rebalancing. These variables influence the dynamic co-movements between stock markets.
Table 3
Normalized Importance Results
The short-term spread is followed by the 3-month T-Bill rate (T-bills 3M) and 3-month LIBOR rate (LIBOR 3M), respectively. Factors with lower relevance are the foreign long-term rates (UK 10 years and UK 30 years). These results reinforce previous empirical and theoretical evidence about the importance of short-term interest rate in portfolio decisions and capital flows (Bruno & Shin, 2015; Rapach et al., 2016, 2016; Poshakwale & Mandal, 2017; Bodenstein et al., 2017).
It is important to mention that the EUR/USD exchange rate is also a key variable influencing dynamic stock market relationships. It could be explained in two ways: i) it is closely related to the interest rate, changes in the short- term rate affect investors’ attractiveness and appetite for local markets, and i) changes in the currency also affect the real return on portfolio investment. On the other hand, from a macroeconomic point of view, the exchange rate increases/decreases the costs of imported goods and decreases/increases the price of exports, affecting the competitiveness of local companies.
Conclusions
This research analyzed the dynamic dependence between the U.S. and the global stock market returns and tested if monetary variables described changes in this relationship, during the January 2000 - June 2016 period. To attain these objectives, an innovative twofold methodology was implemented. Firstly, to examine dependence between the American and world stock market a dynamic copula approach was applied. Secondly, to determine whether monetary variables explain changes in co-movements between those two markets, a neural network approach was employed.
Copula results evidence that there is a strong relation between the U.S. stock market and the global equity market. This relation during the whole period averaged is 0.62, nearing 0.7 during long periods. According to the financial literature, this can be considered a case of an interdependence phenomenon between these two equity markets. This high dependence can be attributed to the American large market share in the financial and economic global processes.
Neural network model findings showed that monetary variables suitably describe changes in stock markets co-movements. The estimated model seems to be very accurate with an average error of 0.049% between the target outputs and the predicted ones. In reference to the importance of monetary variables, the short-term interest rate spread was the most important variable which explained changes in stock dependence, followed by the 3-month T- bills rate and 3-month LIBOR rate.
Our evidence is important to monetary authorities and to portfolio and risk managers. It reinforces theoretical and empirical findings about the incidence of short-term interest rates in stock dependence since these monetary variables affect asset allocation and portfolio decisions. In this sense, changes in short-term interest rates impact capital in-and-out flows, having significant effects in stock markets through higher volatility and lower mean returns of share prices. At the same time, it influences stock markets’ dependence changes by promoting the creation of contagion and interdependence phenomena.
It is important to broaden research about stock dependence concerning which variables explain changes in stock market relationships. Hence, future research should include other economic and non-economic variables, analyzing other countries and periods and, finally, examining the importance of monetary policy shocks during calm and crisis periods on economic activity and financial operations. Empirically, further studies might include other approaches such as causality analysis, graph theory, or dynamic conditional correlation.