Introduction
English language proficiency in Colombia has become increasingly important among university graduates (Alonso-Cifuentes et al., 2018). Knowledge of a second language allows graduates to access scientific literature, better-paying jobs, or postgraduate education abroad (Alonso-Cifuentes et al., 2018). In a broader sense, it has been documented how English proficiency contributes to increased productivity, trade relations, and economic growth (Alonso-Cifuentes et al., 2021).
Recognizing the significance of acquiring a second language, the Colombian government has implemented several initiatives to foster it. Law 115 of 1994 includes second-language competence as one of the goals of primary education. Years later, the Colombian Ministry of Education (MEN) created the 2004-2019 National Program for Bilingualism (PNB), which had as its goal the strengthening of foreign-language teaching in pre-school, primary, secondary, and higher education (Ministerio de Educación Nacional, 1994). As a result, MEN established the Program for Strengthening the Development of Foreign Language Competences (PFDCLE), which set as a goal that, by 2014, 20% of higher education graduates would have reached an intermediate or advanced English proficiency level.
Later, in 2014, MEN set the goal of making Colombia the country with the best education system in Latin America, with the highest English proficiency level by 2025 (Ministerio de Educación Nacional, 2014). The same year, the 2015-2025 National Program for English, called “COLOMBIA Very Well!”, defined its objective to strengthen English-as-a-second-language acquisition, setting the goal of 50% of students during that period reaching a pre-intermediate (B1) level in the national standardized test for secondary education students, Saber 11. The goal at the higher education level was for 30% of students to reach a B1 level and 25% to reach an intermediate (B+) level in the Saber PRO standardized test1. Years later, the 2014-2018 Bilingual Colombia Program set less ambitious goals for the intermediate level. By 2018, 8% of students were expected to reach the pre-intermediate level and 35% the A2 level (Ministerio de Educación Nacional, 2015).
In Colombia, the quality of education is measured through the Saber standardized tests administered by the Colombian Institute for Education Assessment (Icfes). The Saber 11 test assesses secondary education, whereas the Saber PRO test is applied to higher education programs. Both tests are necessary to achieve the corresponding degree and assess English proficiency according to the Common European Framework of Reference for Languages (CEFRL).
In the first study ever to investigate the performance of university graduates in the area of economics, Alonso-Cifuentes, Estrada-Nantes & Mueces-Bedón (2018) resorted to Saber Pro results to conclude that the goal set by MEN for the year 2014 was effectively achieved for graduates in that area. The authors found that, even though 26.3% of students achieved an intermediate or advanced level (B+), 55% of those students graduated from only six universities: Colegio Mayor Nuestra Señora del Rosario, Pontificia Universidad Javeriana Bogotá campus, Universidad Icesi, Universidad de los Andes, Universidad EAFIT, and Universidad Nacional de Colombia. The authors reported that only two of those universities were not located in Bogotá, the country’s capital (Universidad Icesi, in Cali, and Universidad EAFIT, in Medellín). After this paper, no other studies have addressed the question of the trends and the evolution of English acquisition among graduates in the field of economics in Colombia.
This paper aims to extend previous research on the evolution of competence development in Colombian economics programs. Specifically, our research objective is to examine the evolution of the distribution of English competence development among graduates in the field of economics in Colombia during the 2010s. In other words, we will not focus on whether a section of students achieved a given goal or not but on the changes in the distribution of the assessment of graduate performance regarding their linguistic competence. To achieve this objective, we will compare the distribution of results for the English section of the Saber Pro test at the beginning of the previous decade to the ones obtained at the end of the decade. To compare the distributions, we will use the Relative Distribution Method (RDM), a nonparametric technique through which the distribution of discrete, continuous variables can be compared. Then, to analyze every level, it is important to guarantee that enough data about each program is available. Thus, a comparison will be made between the 2010-2011 (beginning of the decade) and 2019-2020 (end of the decade) periods.
The present analysis offers three contributions. First, as far as the authors know, this paper is the second of its kind to study the development of English-language competence for economics programs in Colombia. Second, it is the first to study -using the nonparametric technique of RDM- the distribution of results at the different performance levels of the English section of the test, without focusing exclusively on a segment of the distribution, as Alonso-Cifuentes, Estrada-Nantes & Mueces-Bedón (2018) did. Third, this paper analyzes the evolution of competence development during the 2010s, unlike an earlier study focusing on a single year.
This paper is composed of five additional sections in addition to this introduction. The next section reviews the (scarce) existing literature. A third section presents the methodology chosen. A fourth section describes the data under analysis. The fifth section presents the findings, with some final thoughts in the sixth section.
Literature Review
The English proficiency level developed by higher education students has been analyzed from different fields of knowledge. In the field of economics, the work by Alonso-Cifuentes, Estrada-Nantes & Mueces-Bedón (2018) has already been mentioned. The authors assessed the extent to which economics graduates had achieved the bilingualism goals proposed by the Colombian government for the year 2014. The authors resorted to parametric and non-parametric proportion tests to conduct their assessment. The data were obtained from the English section of the Saber Pro test during the 2011-2015 period. According to the results, at the national level, only seven out of 21 programs with quality accreditation achieved the bilingualism goals proposed. This means that out of 61 evaluated programs, only 11% achieved the goals. These findings highlighted the need to reconsider the bilingualism policy in training future economists in Colombia.
Similar studies in the country have been proposed for other fields, such as accounting (Alonso-Cifuentes et al., 2021), nursing (Alonso-Cifuentes et al., 2019), psychology (Alonso-Cifuentes, Estrada-Nantes, Mueces-Bedón & Sandoval-Escobar, 2018), medicine (Alonso-Cifuentes, Díaz et al., 2018) and software development (Alonso-Cifuentes et al., 2016). These studies also resorted to parametric and non-parametric proportion tests. The data were obtained from the same source for different years. All these papers analyze the accomplishment of MEN goals. Still, no analysis has been conducted of the evolution of the distributions of student performance in the English section of the test for each one of the programs.
As mentioned in the Introduction, our objective is to study how the distribution of results of English-language performance levels among graduates in the field of economics has evolved, specifically through the Saber Pro test in Colombia. Handcock & Morris (1999) proposed a nonparametric methodology that allows for comparing two distributions of a single variable, whether discrete or continuous. This approach is known as the Relative Distribution Method (RDM). As will be shown in detail in the Methodology section, changes in the distribution quantiles can be compared using the RDM.
The RDM has been used in different fields. For example, Handcock & Morris (2006) present an application of the RDM for income based on race and gender between 1967 and 1997 in the US. The authors graphically analyzed income inequality for three groups: white women, African Americans, and African American men. The authors found that, during the period in question, the three groups showed a greater increase in income compared to white men and that the greatest increase occurred during the 1970s. Andrade et al. (2010) used the RDM nonparametric approach to investigate the impact of Portugal’s integration into the European Union on employee income distribution in Portuguese municipalities for the 1985-1991 period. Through relative distribution, they show how there were fewer employees at the bottom of the distribution in 1991 compared to 1985, whereas there were more at the top, i.e., they found fewer employees with a low income and more with a higher income. Borraz et al. (2011) applied the RDM to analyze the evolution of the middle class and polarization in Uruguay for the 1994-2004 and 2004-2010 periods. They found that in the 1994-2004 period, income inequality increased, the middle class decreased, and polarization of income was higher. In this field, works by Agú (2013), Petrarca & Ricciuti (2015), Panek & Zwierzchowski (2020), Schettino et al. (2021), Ricci & Scicchitano (2021) using the RDM to analyze changes in the distribution of income in different countries may also be mentioned.
Furthermore, we find applications of the RDM in health and education. For instance, Contoyannis & Wildman (2007) use the method to describe changes in the distribution of body mass index (BMI) in England and Canada during the 1994-1995 and 2001-2021 periods. Alonso-Cifuentes et al. (2015) applied this method to determine changes in English proficiency among students who completed their higher education studies in Colombia. The authors compared the proficiency levels before and after they completed higher education using the results of the Saber 11 and Saber Pro tests published by Icfes as data. As far as the authors know, only this paper has used this methodology to any effect in Colombia.
Finally, Soares & Delgado (2016) used the method to determine inequality in learning outcomes among primary school students between 2005 and 2013 in Brazil, using results from state and local schools that participated in tests conducted every two years.
Data
Microdata from the Saber Pro test results corresponding to the 2011-11 and 2019-20 3 periods were used to conduct this analysis. These were made public by Icfes and provided socio-economic information about the students, their educational institutions, and the results achieved by the students in each one of the fields under assessment.
The results of the Saber Pro test for the 2010-11 period were established as the reference group for the beginning of the decade, with the 2019-20 period (the end of the decade) as the comparison group.
The 2010-11 period originally included 494,930 records, and the 2019- 20 period included 507,196 records. To identify and select the economics programs, the database created by the National Information System for Higher Education (SNIES) was used, and it is administered by MEN. The students belonging to the programs “Economía” (Economics), “Economía y Negocios internacionales” (Economics and International Business), and “Economía y Finanzas internacionales” (Economics and International Finance) were selected (see Table 1). 81 programs were considered, with 4,836 students for the 2010-11 period and 5,903 students for the 2019-20 period (see Table 1).
It should be noted that, in Colombia, academic programs are subject to high-quality accreditation processes. Quality accreditation is a recognition granted by the State through the National Accreditation Council (CNA) to programs that have provided evidence of high-quality standards in their academic, administrative, and management processes. In theory, the evolution of the distribution of English-competence development among graduate students in the field of economics in Colombia during the 2010s could be different for accredited programs compared to those that are not. Consequently, it was necessary to identify programs that had been accredited and those which had not. To conduct an analysis of accredited programs, a database administered by MEN was used, which relies on data provided by CAN, containing a list of accredited programs and the date in which the first accreditation was granted, as well as successive re-accreditations.
Table 1
Economics programs and their different denominations, according to SNIES and number of students who took the Saber Pro test at the beginning and at the end of the decade
Before moving on, we should return to the choice of two-year periods instead of one-year periods, marking the beginning and the end of the decade under study. Two years were decided for each period under analysis because one year was insufficient to collect the necessary data and conduct an adequate analysis for each program. An analysis of the robustness of the data obtained for two-year and three-year periods was conducted to validate this choice, determining that there are no significant differences for indices shown for each section of the results. Supporting this conclusion is a means difference test with a confidence level of 99% (with Bonferroni correction). Likewise, it was found that both distributions exhibited similar variance, which indicates that the results are consistent regardless of whether the two- or three-year period is used for comparison. Figure A1 and Figure A2 in the Appendix show how the values for each index for two- and three-year periods are organized along a 45-degree line, except for certain atypical values indicated in both figures.
Returning to the data, the English section of the test assesses the achievement of English proficiency by classifying student performance using the A1-, A1, A2, B1, and B+ levels. These results include the equivalence between these levels and the CEFRL, as presented in Table 2 (see Alonso- Cifuentes et al., (2021) for a more in-depth description and discussion of the English proficiency levels evaluated by the Saber Pro test).
Table 2
Equivalence between CEFRL levels and the Saber Pro test classification
Methodology
To analyze changes in the distribution of the English proficiency levels (A-, A1, A2, B1, and B+) of economics graduates, we will use the Relative Distribution Method (RDM), a nonparametric technique through which statistical inference can be formulated concerning the difference between two distributions of the same variable: the reference group and the comparison group.
The RDM was proposed by Handcock & Morris (1999) and is based on the distribution analysis that makes it possible to evaluate changes to identify differences along a given period. The RDM considers two types of population: a reference group and a comparison group. Through this technique, it is possible to compare two distributions and observe changes between them at different points, evaluating their evolution, as opposed to medians, standard deviations, or variation coefficients, which are commonly used metrics to determine distribution.
For the purposes of this study, the reference group consisted of students who took the Saber Pro test during the 2010-11 period. The comparison group consisted of students who took the test during the 2019-20 period.
According to Handcock & Morris (1999), a random variable was defined (which describes the groups being studied) for the
reference group as  with its corresponding cumulative distribution function (CDF) being F
0 (Y) and the density function being
with its corresponding cumulative distribution function (CDF) being F
0 (Y) and the density function being  .
.
Conversely, let Y be the same random variable of the comparison group, whether it is different or the same, at a different point or under a different comparison. The CDF will be defined now as F (Y ) and the density function as f (y).
Through the RDM, it will be possible to identify whether the distribution of the comparison group differs from the distribution of the reference group. Handcock & Morris (1999) define the random variable R as the relative distribution of Y in relation to Y0:
 (1)
(1)
R corresponds to the relative range of the median of population Y compared to Y 0. Furthermore, it is easy to show that R is continuous with [0, 1], its CDF G corresponds to:
 (2)
(2)
where r is the realization of R4 and  is the quantile function of F
0 and r.
is the quantile function of F
0 and r.
We will refer to the density function of R as the relative density function g (r) and it is defined as the derivative of G (r):
 (3)
(3)
The relative density function g (r) can be understood as the relationship between the probability of the comparison group and that of the reference group. As a property of this function integrates to 1 over the unit interval as it is a probability density function. Then in terms of the original measurement scale, g (r) will be expressed as:
 (4)
(4)
For the sake of simplicity, a continuous random variable has been used here. Handcock & Morris (1999) explain how easily such an expression could be modified for the case of the discrete random variable simply by using a random transformation of the discrete distribution while also guaranteeing that the relative distribution is continuous, even if the original distributions are discrete.
Now, let Y
0 and Y be discrete random variables corresponding to the measurement of the reference group
and the comparison group, respectively, with a set of results  , where N can be infinite. In other words, in case Y0 is discrete, the discrete density
functions will be
, where N can be infinite. In other words, in case Y0 is discrete, the discrete density
functions will be  and
and  for i = 1, 2, . . . , N (in our case N = 5). And the cumulative distribution function for Y
0 will be
for i = 1, 2, . . . , N (in our case N = 5). And the cumulative distribution function for Y
0 will be  , for y ∈ Z.
But since F0 (Y) is not continuous, Handcock & Morris (1999) use uniform distribution to transform the discrete function and achieve a transformation such as the one presented in (1), with a satisfactory comparison scale for both distributions.
Thus, the discrete cumulative probability for the reference group will be:
 (5)
(5)
with  for i = 1, 2, . . . , N and
  being the uniform distribution for the interval (a, b].
Consequently, the discrete relative distribution will be:
and R maintains the properties of the case of continuous variables mentioned before. Similarly, the cumulative distribution function and the density function will be:
 (6)
(6)
and
 (7)
(7)
In spite of g (i) being discrete, it maintains the properties of the density function for the continuous case (Handcock & Morris, 1999). When g (i) = 1, the distributions are identical for quantile i. When g (i) > 1 the occurrence probability for the comparison group is greater than for the reference group for quantile i. When g (i) < 1 the probability in the comparison population is lower than for the reference group for quantile i. Handcock & Morris (1999) find the distribution for the g (i) estimator, by allowing for the inference of estimated values of g (i).
Thus, our approach will be to calculate g (i) for each of the possible values of the English section of the Saber Pro tests. For each group under study, the reference group will be defined, with all of the individuals reported for said group in the Saber Pro database for the 2010-11 period, and the comparison group will be defined with all the individuals belonging to the same group for the 2019-20 period. The economics programs will be grouped as follows:
i) all the economics programs; ii) all the other university programs (without economics); iii) economic programs at public higher education institutions; iv) economics programs at non-official higher education institutions; v) accredited economics programs at the beginning and the end of the decade; vi) economics programs at higher education institutions that had not been accredited at the beginning of the decade and accredited at the end; vii) unaccredited economics programs at the beginning and at the end of the decade; and ix) every economics program with at least 20 students during the 2010-11 and 2019-20 periods.
Findings
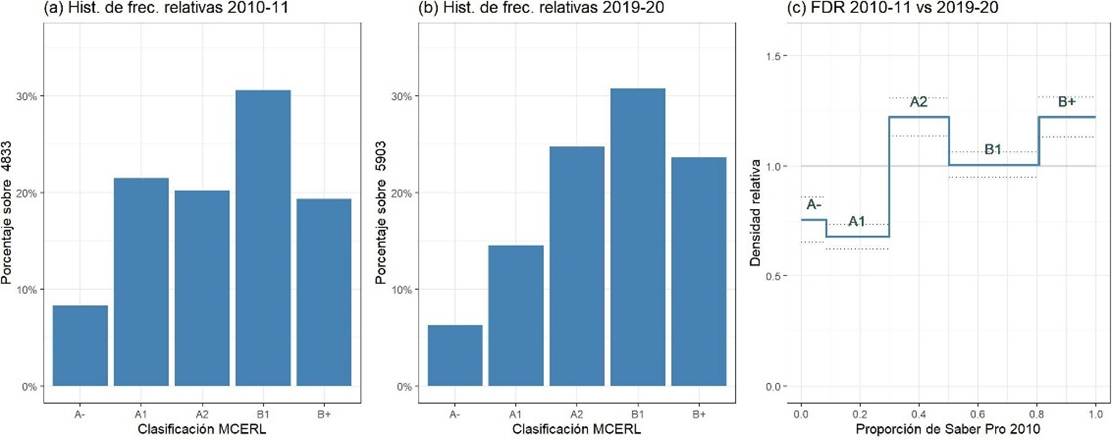
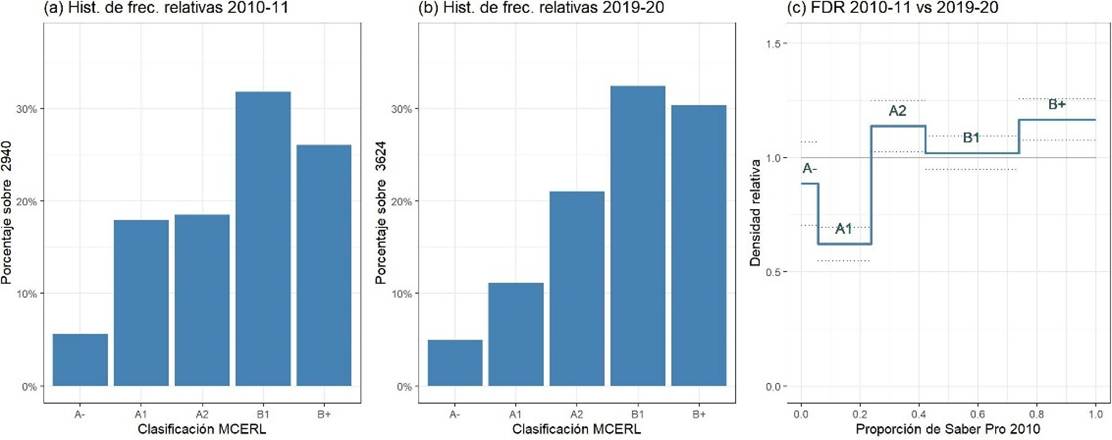
Panel (a) of Figure 1 presents the distribution of covariates for every student of an economics program who took the English section of the Saber test for the 2010-11 period. Panel (b) presents the distribution for the 2019-20. As evidenced, the concentration of the population changes. For the 2010-11 period, there were similar percentages of students for A1, A2, and B+ levels (21.50%, 20.24%, and 19.32% respectively). Nevertheless, for 2019-20, the population was concentrated in the highest proficiency levels (B1 and B+), with 54.43% (30.8% and 23-63% respectively). Coincidentally, the number of students with an A2 proficiency level decreased, going from 8.31% in 2010-11 to 6.28% in the 2019-20.
The third panel shows how the Relative Distribution Function (RDF) (g (r) was estimated and the 95% confidence intervals for values found. The horizontal axis represents the quantiles (i) of the reference distribution according to the proficiency level based on the CEFRL classification. The vertical axis corresponds to the RDF for each quantile (g (i)). The dotted lines represent the boundaries of the confidence intervals. As evidenced in Figure 1, the probability of students reaching the B+ level increased by 22.28%, while it decreased by 24.45% for the A- level. In other words, the distribution changed in the desired direction, but in the case of the proportion for students at the B1 level, there were no significant changes with a 95% confidence level.
Figure 1
Every economics program: relative frequency histograms for English test results for each period (panel (a) and (b)) and Relative Distribution Function (panel (c)) (2010-11 and 2019-20)
Source: Authors’ calculations.
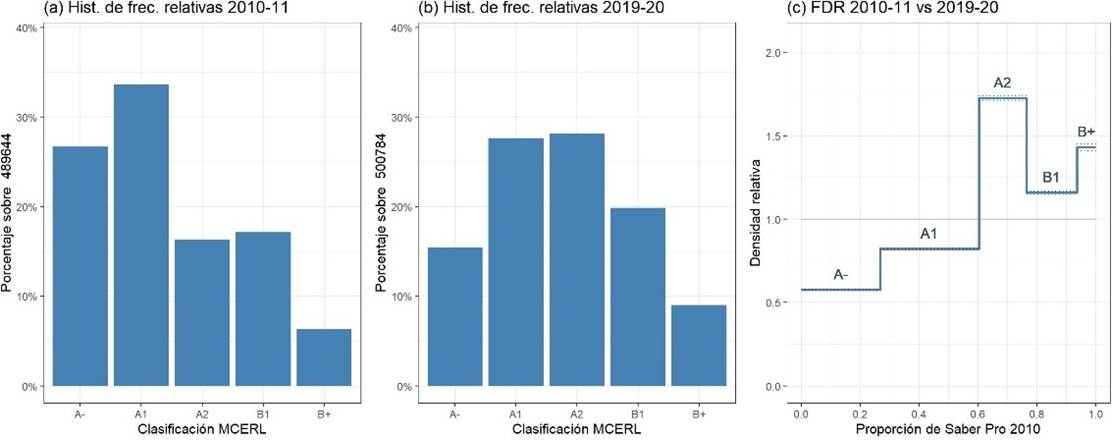
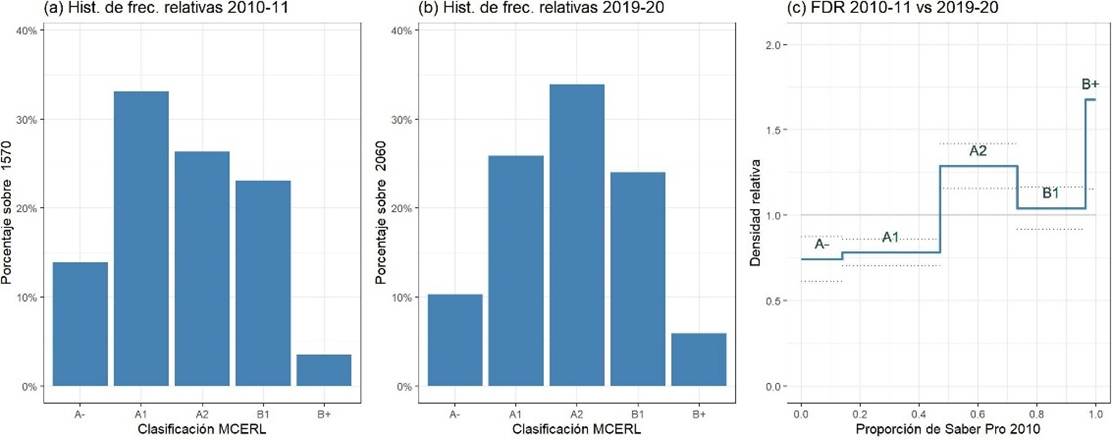
To determine whether the evolution of economics programs was different from that of other programs, we conducted the same analysis for other university graduates in Colombia without considering economics graduates. Panel (c) in Figure 2 shows that the probability of reaching A- and A1 proficiency levels decreased (42.25% and 17.7%, respectively), whereas it increased for the other levels (72.56% for A2, 15.78% for B1, and 43.08% for B+). The percentage of students reaching A2 changed significantly, from 16.29% to 28.12%. On the other hand, the percentage of students reaching B+ went from 6.28% to 8.98%, which implies a higher rate than economics programs. The significant difference between economics programs and other programs occurred at the B1 level, which experienced no change for the economics programs but did change for the others. Nevertheless, the B1 percentage went from 17.12% at the beginning of the decade to 19.8% at the end, whereas the B1 percentage for economics graduates remained stable at 30.8% throughout the decade.
Figure 2
Every other program except economics: relative frequency histograms for English test results for each period (panel (a) and (b)) and Relative Distribution Function (panel (c)) (2010-11 and 2019-20)
Source: Authors’ calculations.
We now direct our attention to economics programs at official higher education institutions. Panel (a) of Figure 3 displays the results obtained by graduates from economics programs at official higher education institutions, which here highly concentrated during the first part of the decade at the A- (12.5%) and A1 (26.8%) levels, with 8.93% reaching the B+ level. The percentage of students reaching the A- and A1 levels went down to 8.3% and 20% by the end of the decade, a desirable outcome (see panel (c) of Figure 3).
Likewise, there is a considerable increase of 33.3% at the A2 level. At the same time, there are no significant changes for B1 (as seen in the graph showing economics programs), with an increase at the B+ level of 44.8%.
Figure 3
Economics programs at official higher education institutions: relative frequency histograms for English test results for each period (panel (a) and (b)) and Relative Distribution Function (panel (c)) (2010-11 and 2019-20)
Source: Authors’ calculations.
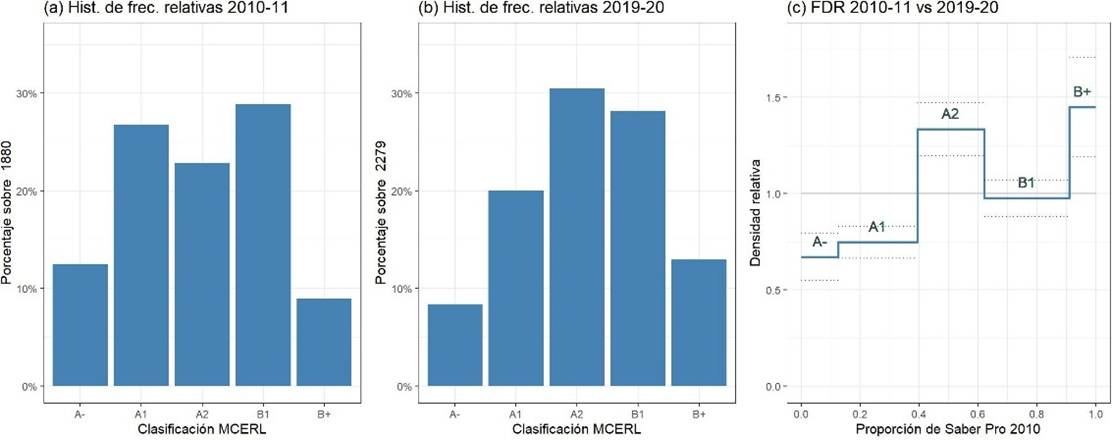
Conversely, a different behavior can be observed for economics graduates from non-official higher education institutions (see Figure 4). At the beginning of the decade (see panel (a), the percentage of students reaching B1 was the highest (31.8%), which remained consistent throughout the decade (32.45% by the end) (see panel (b)). There are no statistical differences between the two proportions (see panel (c)). The same is true for the distribution of students reaching an A- level, which was relatively low (5.6%) at the beginning of the decade (4.97% at the end of the decade). In the case of the B+ level, a significant increase occurred, as it went from 26.05% to 30.35%. These results indicate the different distribution between official and non-official higher education institutions.
Figure 4
Economics programs at non-official higher education institutions: relative frequency histograms for English test results for each period (panel (a) and (b)) and Relative Distribution Function (panel (c)) (2010-11 and 2019-20)
Source: Authors’ calculations.
Based on the data provided by CNA, programs could be classified as i) those with quality accreditation at the beginning and the end of the decade (18 programs); ii) those that had no quality accreditation at the beginning but which did at the end (17 programs); and iii) those which had no quality accreditation either at the beginning or at the end of the decade (33 programs).
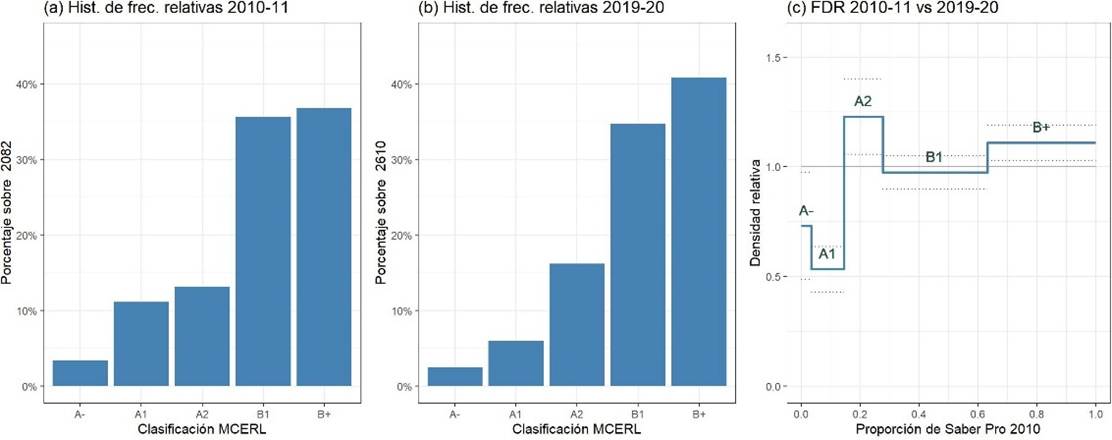
The distribution of graduates’ proficiency levels from accredited pro- grams at the beginning and the end of the decade (see Figure 5) is noticeably different from those of the economics graduates overall. For both periods, a majority of graduates reached B1 and B+ levels: 72.29% for 2010-11 (see panel (a)) and 75.47% by the end of the decade (see panel (b)). The proportion of students reaching B1 had no statistically significant differences (see panel (c)). The B+ percentage is greater by the decade’s end (10.9% higher), going from 36.7% to 40.8%. The increase may be explained by decreased students reaching A- and A1 levels. Nevertheless, the A2 percentage increased by 22.8%, from 13.16% to 16.16%. These findings indicate a desirable outcome for accredited programs.
Figure 5
Accredited economics programs at the beginning and at the end of the decade: relative frequency histograms for English test results for each period (panel (a) and (b)) and Relative Distribution Function (panel (c)) (2010-11 and 2019-20)
Source: Authors’ calculations.
By the end of the decade, there were 17 programs with quality accreditation that had no accreditation during the 2010-11 period. Figure 6 shows whose relative distribution is highest (compared to the other groups) for B+, with a value of 1.752 (see panel (c)). Graduates from these programs reaching B+ went from 9.6% to 16.95%. The increase resulted in fewer students reaching an A1 level. For the other levels, there were no significant changes. This change is noteworthy, and further research should explore whether there is a causal relationship between the improvements resulting from the accreditation process and the change reported here.
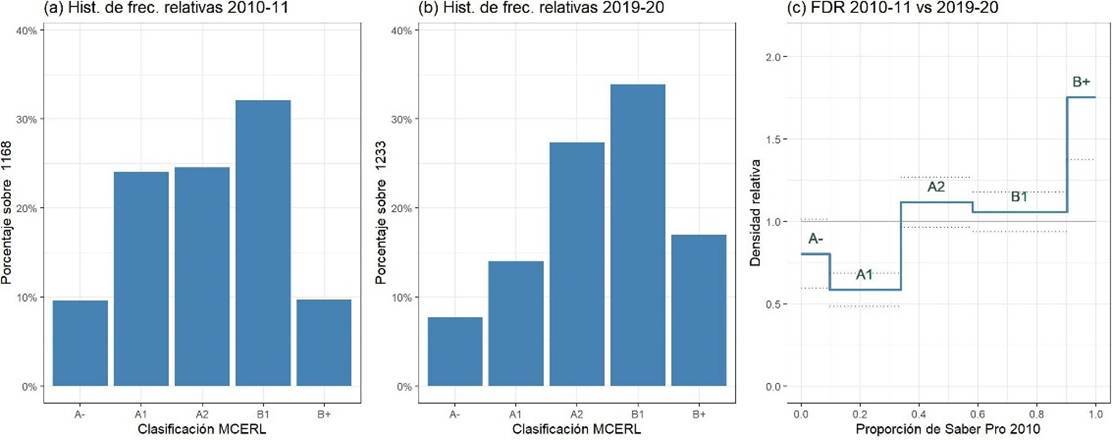
Programs without quality accreditation, either at the beginning or at the end of the decade, experienced a low percentage of students reaching B+ (3.5% at the beginning and 5.8% at the end). Nevertheless, there was a significant chance with an RDF of 1.6766, which indicates a significant increase of 67.66% (see panel (c) of Figure 7). The distribution decreased for the A- (from 13.88% to 10.29%) and A1 (33.1% to 25.8%) levels and increased for the A2 level (26.36% to 33.9%). These findings suggest a clear association between quality accreditation and result distribution for English proficiency levels.
Figure 6
Economics programs without quality accreditation at the beginning of the decade and with accreditation by the end: relative frequency histograms for English test results for each period (panel (a) and (b)) and Relative Distribution Function (panel (c)) (2010-11 and 2019-20)
Source: Authors’ calculations.
Figure 7
Economics programs without quality accreditation at the beginning and the end of the decade: relative frequency histograms for English test results for each period (panel (a) and (b)) and Relative Distribution Function (panel (c)) (2010-11 and 2019-20)
Source: Authors’ calculations.
Finally, we will direct our attention to each program’s level. Table A1 (see Appendix) shows the RDF findings for each one of the programs with enough notes for both periods.2 Figure 8 displays these findings. The horizontal axis shows the “lower index”, which corresponds to the proportion of change in the number of graduates at the A- level (or A1 in cases where the program had no A- graduates for the first period), i.e., the RDF value for A-. Thus, if the value is less than 1, it means that the proportion of students reaching A- decreased in comparison to the reference period (2010-11); if it is equal to 1, it means that there were no significant changes; if it is greater than 1, it is because the proportion has increased. Furthermore, if the index is 0, it indicates that for the final period, there were no graduates at the A- level. Concerning the lower index, Universidad Nacional, Universidad EAFIT, and Universidad la Gran Colombia stand out, as they had no students at the A- level. Conversely, Universidad Santo Tomás (Bucaramanga) and Universidad Pontificia Bolivariana had lower index values greater than 7, which indicates that the proportion of students at the A- level increased by over 600%.
Similarly, the vertical axis measures the “upper index”, corresponding to relative changes at the B+ (or B1 levels, in some cases where universities had no students reaching B+ during the first period). Similar to the lower index, if the value is less than 1, it means that the proportion of students reaching B+ decreased to the reference period; if it is equal to 1, it has remained constant; if it is greater than 1, the higher the value, it indicates a greater growth in the proportion of graduates reaching a B+ level with respect to the reference distribution. Some leading universities in this respect were Universidad de Pamplona, Universidad Libre, and Universidad Cooperativa de Colombia (Bogotá Campus), with indices of 6.417, 4.1, and 3, respectively (see Figure 8).
Figure 8
Upper and lower indices for higher education institutions with and without quality accreditation (2010-11 and 2019-20)
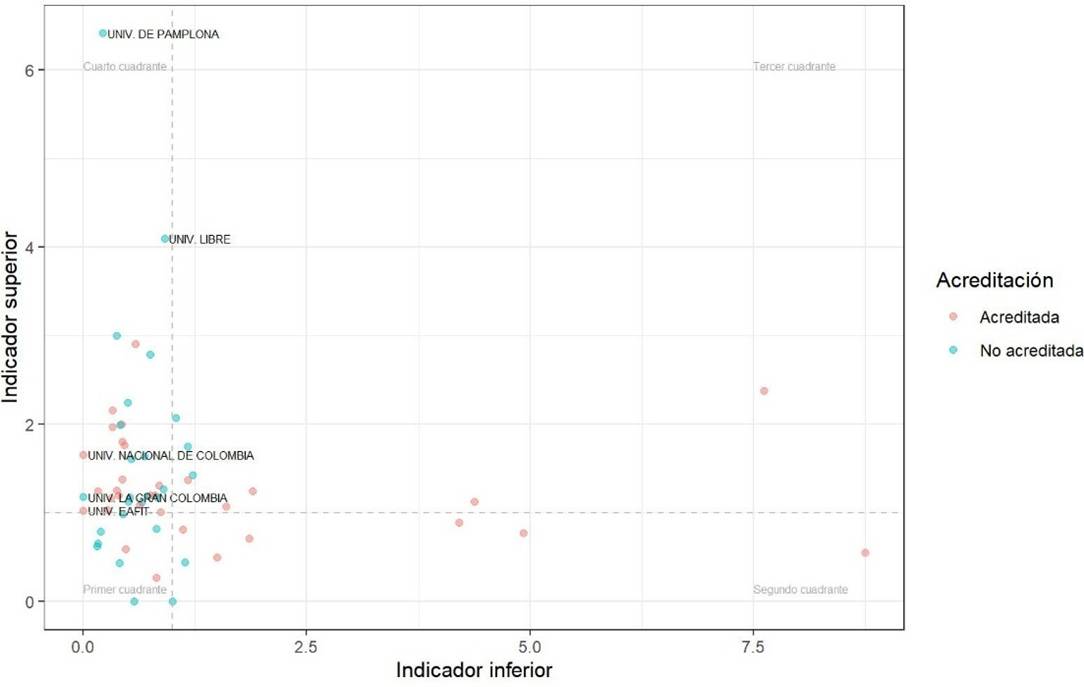
Source: Authors’ calculations.
Figure 8 shows four quadrants. The first quadrant corresponds to programs with a reduced proportion of graduates reaching both A- and B+ (or B1); in other words, programs for which the distribution of language proficiency was centralized. This quadrant includes nine programs,3 of which only 2 have quality accreditation. Similarly, quadrant 2 corresponds to programs with an increased proportion of students in the lower tail and a decreased proportion in the upper tail. These outcomes are not desirable. This quadrant includes seven programs,4 six of which have quality accreditation. Quadrant 3 displays the programs that improved in the upper end of the distribution but also experienced growth in the lower tail. These programs exhibit a polarized distribution in the values for this item;5 5 of them have quality accreditation. Finally, the fourth quadrant displays those programs with the desirable outcome of increasing the proportion of students in the upper tail and decreasing the lower tail. 34 programs appear in this quadrant,6 of which 19 have quality accreditation.
Finally, red dots indicate accredited programs and blue dots indicate those without quality accreditation. 5.88% of accredited programs are in the first quadrant, and 17.64% are in the second quadrant. On the other hand, quadrants 3 and 4 gather 14.7% and 55.88% of accredited programs, respectively. Most programs are in the fourth quadrant, the most desirable outcome concerning English proficiency among economics graduates. This indicates that most programs have improved English proficiency among their students.
Conclusion
Proficiency in English constitutes a necessary competence for any university graduate. In Colombia, the Saber Pro tests measure the degree to which this competence is developed by students who are about to conclude their training at the university level. This paper has reviewed their performance in comparing the distribution of results for economics programs in the English section of the text at the beginning and the end of the past decade.
Our nonparametric approach reveals significant changes in the values reached by students concluding their studies in economics throughout the decade. For the 2010-11 period, levels A1, A2, and B+ had similar distributions. However, for the 2019-20 period, there was an increase in the proportion of students reaching B1 and B+ levels, with a decrease in the A2 level. The Relative Distribution Function (RDF) analysis showed a 22.28% increase in the probability of students at the B+ level and a decrease of 24.25% in the likelihood of students at the A- level. These changes indicate a favorable direction in the distribution, even though the proportion of students at the B1 level showed no significant changes.
Comparing economics programs in Colombia to other university programs, it became clear that there was a decrease in the probability of reaching A- and A1 levels for programs other than economics. In contrast, the prob- abilities for the different levels increased. Specifically, the percentage of students at the A2 level rose from 16.29% to 28.12%; likewise, the percentage of students reaching the B+ level went up from 6.28% to 8.89%. These changes are greater than those observed for the economics programs, which indicates a significant difference in the evolution of these groups.
Economics programs at official higher education institutions have experienced a change in the distribution of students throughout the decade. Earlier, there was a high concentration of students at the A- (12.5%) and A1 (26.8%) levels; however, by the end of the decade, there was a decrease of 8.3% and 20% respectively. Conversely, A2 and B+ levels experienced an increase: level A2 increased by 33.3% and level B+ by 44.8%. On the other hand, the pattern for economics programs at non-official higher education institutions was different. At the beginning and the end of the decade, the highest percentage of students remained at the B1 level (31.8% and 32.45% respectively). As for the A- and B+ levels, there were no significant changes in their distribution (5.6% at the beginning, 4.97% at the end for A-, 26.05% at the beginning, and 30.35% at the end for B+).
Upon closer examination, three groups were identified among programs with quality accreditation: those with quality accreditation both at the beginning and at the end of the 2010s; those who obtained their accreditation at the end and did not have it before; and those programs without quality accreditation either at the beginning or at the end of the decade. These findings support the idea that there is a clear relationship between accreditation and the distribution of learning outcomes in English, even though there is still room to explore the causal relationship.
If the programs are individually analyzed, some universities experienced significant changes in the proportion of students at the A- and B+ levels. Universidad Nacional, Universidad EAFIT, and Universidad la Gran Colombia had no students at the A- level during the 2019-20 level. On the other hand, Universidad Santo Tomás (Bucaramanga) and Universidad Pontificia Bolivariana experienced a significant increase in the proportion of students at the A- level. Regarding the B+ level, Universidad de Pamplona, Universidad Libre, and Universidad Cooperativa de Colombia (Bogotá campus) performed above the rest, significantly increasing the proportion of students at this level. These findings highlight the variability of the results among accredited programs and the importance of examining the reasons behind these changes more closely.
The estimated indices offer evidence of a degree of variability of the results among economics programs concerning the English proficiency of their students. Nevertheless, most accredited programs have shown some improvement in this regard, which indicates that effective actions are being implemented to strengthen second-language proficiency among their students. Conducting further research and promoting additional strategies to improve English proficiency for all programs, especially those in the less desirable quadrants, is essential.
This paper contributes to the field’s literature in at least three respects. First, it contributes to the limited literature studying English-language competence development in economics programs in Colombia. Second, it is the first to use the Relative Distribution Method to study the evolution of test result distribution without focusing exclusively on a distribution segment. Third, it analyzes the development of this specific competence throughout the 2010s.
These findings point to the significant heterogeneity found in the results of economics programs in the country regarding second-language competence development. Further research is required to identify the elements that determine these findings. The programs’ duration, the students’ socio-demographic characteristics, and the English-language entry level could affect the findings reported here. In this respect, identifying the elements that determine the development of second-language competence should be considered for further research.
Likewise, it is crucial to conduct added-value studies identifying the programs that generate better outcomes for their students. It should be noted that the entry-level of students at the beginning of their studies is directly related to their proficiency when they complete them. Studying the added value of the programs in terms of second-language competence development is an area that has yet to be fully explored. There are some limitations regarding the data linking the results for the Saber 11 and Saber Pro tests as Icfes supplies them: a significant percentage of individuals need to be registered, and results present a noticeable bias.7 Algorithms should be developed to solve this problem, thus creating more robust samples to study the added value of higher education institutions in developing this competence for economics graduates.
Many questions remain unanswered, so the authors expect other researchers to be encouraged to work on the subject. Furthermore, input from program managers and economics faculty concerning the development of this competence among future economists is also encouraged.