Water pollution index of high Andean micro-basin of the Chumbao River, Andahuaylas, Peru* **


ABSTRACT

During its journey, the river water suffers natural or anthropic contamination, deteriorating its quality. This impact can be qualified by determining the pollution Indexes (IPO). The work aimed to evaluate the spatial and temporal variation of the IPOs in the water of the high Andean micro-basin of the Chumbao River. The study included the section from 13°46'38.4” S, 73°15'32.3” W at 4079 m of altitude up to 13°35'26.4” S, 73°27'00.8” W at 2572 m of altitude. Physical, chemical, and microbiological parameters of the water were determined in 8 points along the river. These were grouped to calculate the IPO by mineralization (IPOMI), organic matter (IPOMO), suspended solids (IPOSUS), and trophic (IPOTRO) in the dry and rainy seasons. The indexes were categorized from 0.0 (not polluted) to 1.0 (highly polluted). The data were collected in triplicate and valuated through ANOVA and Tukey's test. It was found that IPOSUS, IPOMI, and IPOMO. The points near the head of the micro-basin reported no and low pollution; besides, they increased considerably in urban areas reaching highly polluted levels. In contrast, IPOTRO reported a eutrophic state, and that contamination levels were higher in the dry season. The waters of the Chumbao River above 2900 m of altitude and close to the head of the micro-basin do not show contamination, but in the urban area the index of pollution is high.

Keywords:

Organic matter, suspended solids, trophic state


RESUMEN

El agua de los ríos durante su trayecto sufre contaminación natural o antrópica, deteriorando su calidad; una herramienta que permite cualificar este impacto son los índices de contaminación (ICO). El objetivo del trabajo fue evaluar la variación espacial y temporal de los ICO del agua de la microcuenca altoandina del río Chumbao. El estudio comprendió el tramo 13°46’38.4” S, 073°15’32.3” O y 4079 m de altitud a 13°35’26.4” S, 73° 27’00.8” O y 2572 m de altitud. Se determinaron parámetros físicos, químicos y microbiológicos del agua, en 08 puntos del río, en temporada de estiaje y lluvia, y fueron agrupados para el calculó del ICO por mineralización (ICOMI), materia orgánica (ICOMO), sólidos suspendidos (ICOSUS) y trófico (ICOTRO). Los índices fueron categorizados de 0.0 (ninguna contaminación) a 1.0 (muy alta contaminación). Los datos se recolectaron por triplicado y evaluados con un ANOVA y test Tukey. Se encontró que ICOSUS, ICOMI E ICOMO en los puntos cercanos a la cabecera de cuenca reportaron ninguna y baja contaminación, e incrementaron considerablemente en las zonas urbanas llegando a niveles de altamente contaminado, mientras que el ICOTRO reporto estado eutrófico, con niveles de contaminación mayores en temporada de estiaje. Las aguas del río Chumbao por encima de 2900 m de altitud y cercanos a la cabecera de la microcuenca, presenta ninguna contaminación, y en la zona urbana el incide de contaminación es alta.

Palabras clave:

Materia orgánica, solidos suspendidos, estado trófico


1. Introduction

The waters born in the Andes Mountain range are sources of natural aquifers, which reach the flat and low parts through infiltrations. Due to runoff, these waters are considered free of anthropogenic pollutants, and as they flow in the rivers, they carry the particulate material due to erosion, natural waste, domestic and industrial waste [1-2], modifying their physical, chemical, and microbiological characteristics, which could lead to a decrease in its quality and availability, increasing the health risk [3-5].

The surface water available in Peru is relatively abundant; however, it presents uneven spatial distribution, which makes its quality critical in some hydrographic regions [6]; thus, the water of the Chumbao River born in the micro-basin of the same name at 4600 m of altitude, in an area of low vegetation. It has as its main use to cover agricultural demands and, to a lesser extent, the populational and energetic needs [7-8]. This is the reason why the quality of the water is affected because of the expansion of domestic and agricultural activities, causing deterioration of the ecosystems surrounding the river [8], mainly in the districts of San Jerónimo, Andahuaylas and Talavera, which due to lack of adequate drainage and sewerage systems considerably increase the risk of contamination.

The quality of the water is relative to the use given and is related to some physical, chemical, and microbiological parameters, according to the regulations of each country [9]. Peru has Environmental Quality Standards for Water (ECA), which establishes maximum permitted values of substances and pollutants, differentiating the use of water [10].

There are methodologies for assessing and evaluating water quality, such as the water quality index (WQI) [11-14] and the water pollution index [15-16]. These indexes allow evaluating the degree of contamination present in a water body by grouping physical, chemical, and microbiological parameters reducing the information to a simple expression or a single value [15,17]. Knowing the pollution indexes allows determining the type of environmental problem and making an easy estimation due to the small number of variables involved.

These pollution indexes are the IPOSUS (pollution index by suspended solids) which is an important indicator of the physical degradation of water and the presence of contaminants due to the concentration of suspended solids [18-20]; The IPOMI (Index of Pollution by Mineralization) groups hardness as a measure of calcium and magnesium ions, coming from the dissolution of rocks and minerals [21-22] , alkalinity reflecting carbonate and bicarbonate anions [23], and conductivity related to the amount of dissolved ions [24]; The IPOMO (Index of Pollution organic matter), represents the organic contamination of a water body, groups the biochemical oxygen demand, percentage of oxygen saturation and total coliform [25]; and the IPOTRO (Index of Trophic Pollution) which measures the total phosphorus concentration, and is an indicator of eutrophication [26].

Identifying in a fast way the water quality of a high Andean River along its path and its variation will allow immediate actions to be taken as a response to remedy these events. Thus, the objective of the research was to evaluate the spatial and temporal variation of the pollution indexes of the water of the high Andean micro-basin of the Chumbao River.

2. Materials and methods

2.1 Study area

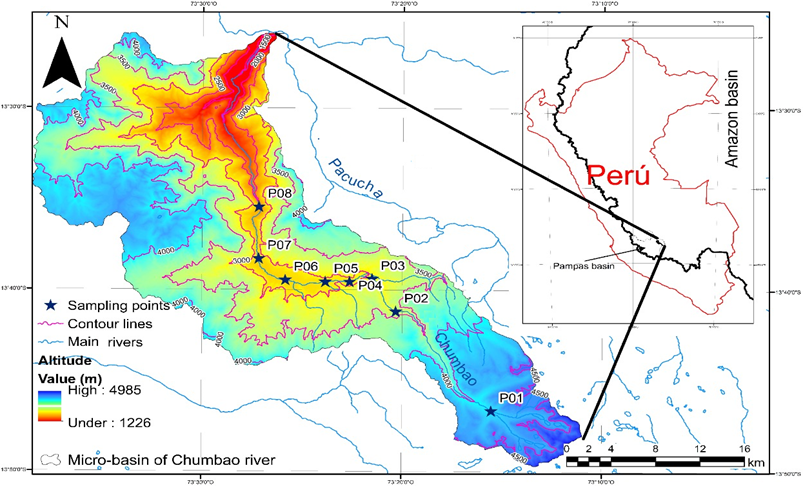
The study was carried out in the Chumbao River, geographically located in the southern highlands of Peru, Apurímac region, Andahuaylas province. Hydrographically, it belongs to the Pampas River basin, a tributary of the Apurímac River. The main tributaries are the Pampahuasi, Paccoccocha, Antaccocha, and Huachoccocha lagoons [Figure 1]. The area of influence presents intense rainfall between October and March (from 500 to 1,000 mm/year) and temperatures from 5 to 23 °C, and average relative humidity of 55%, with a Cwb climate according to Köppen climate classification.

Figure 1

Study area, Chumbao micro-basin

2422-2844-rfiua-105-20-gf1.png

2. 2 Sampling and analysis

Point samples of water were taken from 8 points along the river, from the head of the basin (13° 46'38.4” S, 73° 15'32.3” W, and 4079 m of altitude), to the area known as Sotoccmachay (13 35'26.4” S, 73° 27'00.8” W, and 2572 m of altitude) (see Table 1], during the rainy and dry seasons.

The sampling was carried out according to the criteria established by the National Protocol for Monitoring the Quality of Surface Water Resources (ANA-Perú) [27].

Table 1

Location of sampling points

2422-2844-rfiua-105-20-gt1.png

Physical, chemical, and microbiological parameters of the water were determined in the field and laboratory according to the methodologies shown in Table 2; the analyses were carried out at the water control and analysis research laboratory of the José María Arguedas National University, Andahuaylas, Peru.

Table 2

Parameter Analysis Methods

Parameter Method Reference
Physical
Conductivity Electrometric User manual. Multiparameter HI 9829 - Hanna
Suspended solids Gravimetric/Stove Method 2540-D [28].
Chemical
Alkalinity Spectrophotometric User manual. IRIS model UV-Vis spectrophotometer - Hanna.
Hardness Spectrophotometric with EDTA User manual. IRIS model UV-Vis spectrophotometer - Hanna
Total phosphorus Spectrophotometric Method 4500-P E [28].
Oxygen saturation Electrometric User manual. Multiparameter HI 9829 - Hanna
Biochemical demand oxygen Respirometric Method 5210 D [28].
Microbiological
Total coliforms Multiple tubes Method 9221B-9221C [28].

2. 3 Determination of pollution index

The IPOSUS, IPOMI, and IPOMO, were determined through Equation [1], [2], and [3] respectively [15], the evaluation of each contamination index was detailed in Table 3.

Table 3

IPO values and ranges

2422-2844-rfiua-105-20-gt3.png

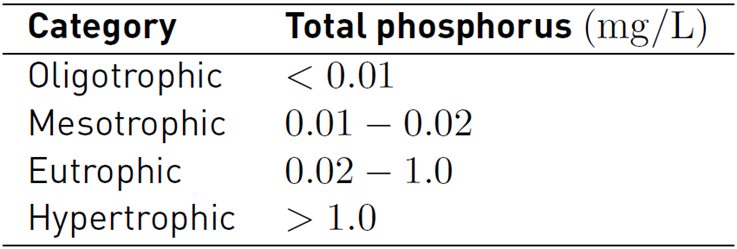
IPOTRO was determined by direct reading of the total phosphorus concentration, which defines a discrete category (see Table 4].

Table 4

Trophic pollution index

2422-2844-rfiua-105-20-gt4.png

Statistical analysis

Data were collected in triplicate, and an analysis of variance (ANOVA) and Tukey’s multiple comparison test were performed at a significance level of 5%.

3. Results and discussion

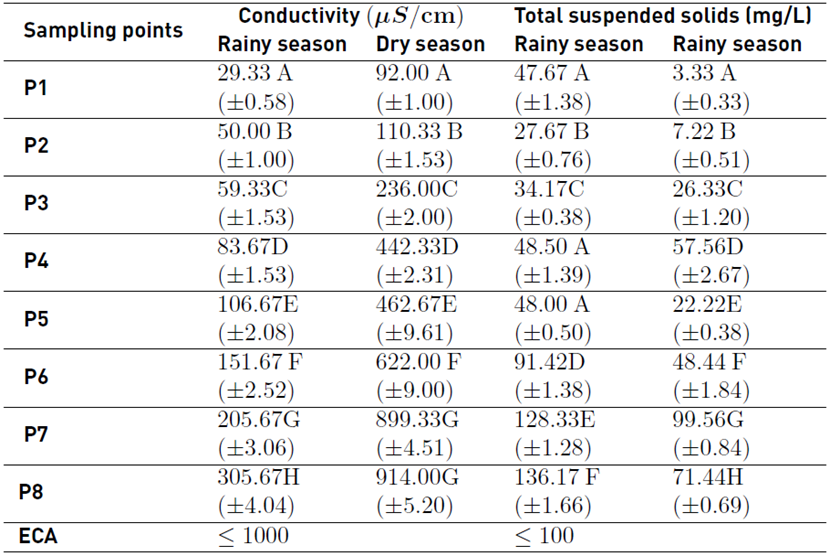
Conductivity is an indicator that allows a first approximation that occurs in a water system due to different factors [29]; the water samples at the sampling points and seasons showed significant difference (p-value < 0.05), ranging from 29.33 to 305.67 µS/cm in the rainy season, and from 92.00 to 914.00 µS/cm in the dry season [Table 5]. It was observed that conductivity increases considerably as the downstream river flows in both seasons. In P1 (4079 m of altitude) in the rainy season, the conductivity was 29.33 µS/cm, which indicates a low presence of soluble ions; this value approximately tripled in the dry season (92.00 µS/cm). This must contribute to the low dissolution due to the absence of rain; it was observed that in the urban influence points from P4 to P7 at 2916 m of altitude, the conductivity increases considerably from one season to another, reaching approximately quadruple the conductivity; this is due to the high anthropic activity, whose wastes are directly thrown into the Chumbao River, such as household wastewater and waste from agricultural activities, granting higher quantity of soluble ions to the river water [30]; however, these values are below the ECA for river waters (< 1,000 µS/cm) (Category 4: Conservation of the aquatic environment) [10]. A similar behavior was observed by [31] in the Utcubamba river in Peru, and [32] in Wen-Rui River of eastern China.

Table 5

Conductivity and total suspended solids of the Chumbao River water

2422-2844-rfiua-105-20-gt5.png

[i]Mean (± standard deviation). Same letters indicate no significant difference at 5%

On the other hand, totals suspended solids reported in the rainy season ranged from 27.67 to 136.17 mg/L, and from 3.33 to 99.56 mg/L in the dry season, showing a significant difference (p-value < 0.05); all the sampling points of both seasons except for points P7 and P8 in the rainy season presented acceptable values according to the ECA [10]. It was also appreciated that the values reported in rains were higher than in the dry season; this is attributed to the slope of the river, which increases the surface runoff from the area adjacent to the river, transporting sediments such as clays, silt, organic and inorganic matter, making the water turbid [33], affecting the passage of light, and limiting the development of aquatic life [34].

Likewise, the suspended solids downstream, near the urban area (P3 to P7), were higher than in the headwaters for both seasons, mainly due to the extraction of aggregates (sand, gravel, stone), construction activities, alteration of the soil by crops, and deforestation, considerably increasing suspended particulate matter.

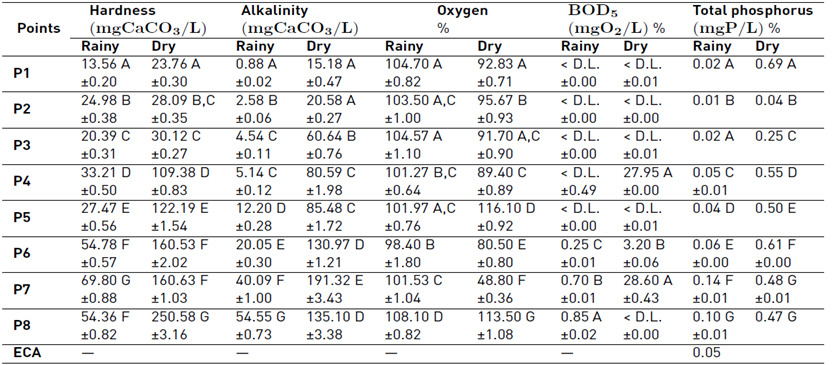
The hardness of the water of the Chumbao River reported a significant difference between sampling points and study seasons (p-value < 0.05). It was found that it ranged between 13.56 to 69.80 mg/L in the rainy season and in the dry season from 23.76 to 250.98 mg/L [Table 6], increasing downstream. However, in the dry season, higher values were reported due to the absence of rain, which increases the concentration of carbonates, which depend on the characteristics of each geological zone and soil type [22-35]]. High carbonate content was also observed in the points near the urban area (P3 to P7), because around points P2 and P3, non-metallic extractive mines are located, using river water for washing the extracted material, which returns to the river without any treatment.

Table 6

Chemical parameters of the water samples of the Chumbao River

2422-2844-rfiua-105-20-gt6.png

[i]Mean (± standard deviation). Same letters indicate no significant difference at 5%. D.L. (detection limit)

As a result of the evaluation, the alkalinity ranged from 0.88 to 54.55 mg/L in the rainy season; and from 15.18 to 191.32 mg/L in the dry season (p-value < 0.05) [Table 6]; it was observed that this variable increases as the water flows downstream, being higher in the dry season. This fact is due to the high slope of the river (approximately 4%), which allows the fixation of CO2 in the water body; however, for P1 to P4 in the rainy season, low values were reported, making the water highly susceptible to acidification in this area [25-36], although this would be subject to the flow of the river.

In the case of the dissolved oxygen, it varied from 98.40 to 108.10% in the rainy season, and from 48.80 to 116.10% in the dry season (see Table 6]. Observing defined areas, from P3 to P5 in the rainy season, the DO decreases slightly, being this a zone of degradation and decomposition due to the presence of organic matter that comes mainly from domestic wastewater and solid waste [37]; this same behavior occurs in zones P3, P4, P6 and P7 in the dry season. In contrast, P8 in both seasons, a recovery zone is observed due to the absence of urbanization; however, the high levels of dissolved oxygen in the water of the Chumbao River are due to the geomorphology of its course [38-39].

In P1, P2 and P3, it is observed that the BOD is not detectable (< D.L.) [Table 6], since around these points there are no dwellings that can produce waste, there are low agricultural and livestock production, and little presence of vegetation, therefore a low presence of carbonaceous matter [40]. Regarding P4 and P5 (from 2916 to 2872 m of altitude), these points have a low populational density, but they develop intensive agricultural and livestock activities, using pesticides and herbicides without control [7], whose residues are transported to the river by runoff or irrigation of residual water, considerably affecting the microflora and microfauna of river water, which could inhibit the decomposition and degradation of the organic matter [41,42]; this same behavior occurs in P8 in the dry season.

On the other hand, the points from P6 to P8 showed low BOD values from 0.25 to 0.85 mg/L in the rainy season, while in the dry season the values reached up to 28.69 mg/L. These areas have a high populational density and in most cases the wastewater and solid waste are thrown off into the river, which favors the increase of BOD [40].

Regarding total phosphorus, it is observed that P1 in the rainy season reported 0.02 mg/L and in the dry season 0.69 mg/L; this considerable difference is due to the low flow of the river in the dry season. Similarly, migration of native birds and auquenids such as vicuña (Vicugna vicugna) are observed. These animals defecate on the banks of the Chumbao River and near the tributary lagoons. This fact increases the levels of phosphorus [43-44], but this decreases rapidly at P2 (0.04 mg/L).

Likewise, it was observed that the phosphorus level increases as the river water flows, exceeding the ECAs established for this parameter (0.05 mg/L) [9], as a result of the dissolution of rocks and phosphate minerals in the headwater and surrounding areas. These levels increase more in urban areas because wastewater is thrown into the river, which comes from homes, agricultural activity, and car washes, which use detergents, a similar behavior reported by [45] and [32].

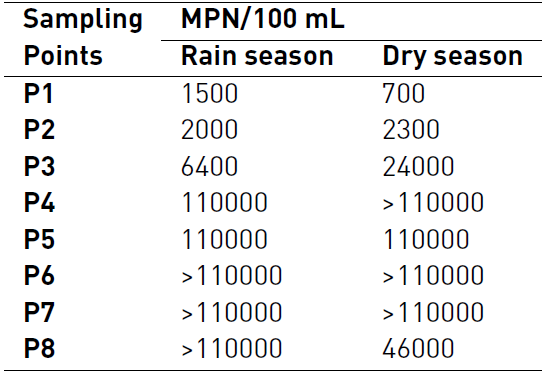
Table 7 shows the level of total coliforms at the sampling points; a considerable increase was observed from P3 in both seasons, indicating anthropic activity, mainly due to the presence of livestock stables near the banks of the river in P3 and P4; likewise, a considerable increase of 11x104 MPN/100 mL was observed from P4, largely due to the discharge of domestic wastewater, and animal slaughter beds, whose used water is discharged directly into the river without any treatment, increasing the microbial load mainly of thermotolerant coliforms [46,47].

Table 7

Total coliforms from the water samples of the Chumbao River

2422-2844-rfiua-105-20-gt7.png

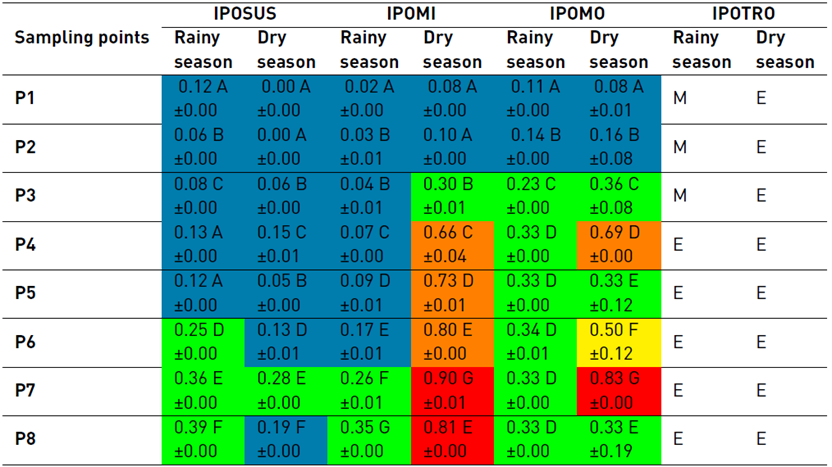
Regarding pollution indexes, the IPOSUS determination [Table 8], in the rainy season from P1 to P5, indicated "none pollution", while from P6 to P8 it showed "low pollution" by suspended solids; on the other hand, during the dry season, it was reported as "none pollution" at all points, except in P7, which indicated "low pollution"; this increase of "no pollution" to "low pollution", is mainly due to erosive and extractive processes [15,48], which occur near the banks of the Chumbao River; however, levels of "medium pollution" to more, would be related to health risk, because of the adherence of toxic substances and pathogenic bacteria to suspended solids.

Concerning the IPOMI, two evaluations were observed in the rainy season, "none pollution" from P1 to P6, and "low pollution" due to mineralization in P7 and P8, indicating low contamination due to the presence of ionized minerals. In contrast, in the dry season, four valuations of contamination by mineralization were observed, in P1 and P2 "none pollution" was reported, indicating pure waters and with low biogenic contributions, low in P3, that is, a slight anthropic incidence; "high pollution" "from P4 to P6; and "very high" in P7 and P8 indicating "excessive pollution" by mineralization mainly attributed to high conductivity values, followed by hardness and to a lesser extent by alkalinity, as mentioned by [49] and [34].

Table 8

Water pollution indexes of the Chumbao River

2422-2844-rfiua-105-20-gt8.png

[i]Mean (± standard deviation). Same letters indicate no significant difference at 5M, mesotrophic; E, eutrophic. D.L. (detection limit)

The determination of the IPOMO (see Table 8], in the rainy season, reported two valuations for pollution due to organic matter, P1 and P2 "none pollution", P3 to P8 showed "low pollution". In the dry season, P1 and P2 showed "none pollution"; P3, P5 and P8 "low pollution", P4 "high pollution", P6 "medium pollution", and P7 "very high pollution", the varied behavior in the dry season is related to the BOD level (see Table 6], those values were below the detection limit, and this would be due to the presence of pesticide and herbicide residues present in the water, which could cover the IPOMO values.

The contamination by nutrients evaluated through the IPOTRO evidenced that the water of the Chumbao River, in the rainy season, in P1, P2 and P3 reported a mesotrophic state, which indicates clear waters, with the presence of aquatic plants, with low levels of nutrients; in contrast from P4 to P8 in the rainy season, and from P1 to P8 in the dry season, the eutrophic state was reported, which indicates that the river water presents high levels of nutrients associated with the concentration of total phosphorus [44].

4. Conclusions

The water of the high Andean River of the Chumbao presented a longitudinal and seasonal variation of the pollution valuation, calculated through IPOSUS, IPOMI, IPOMO, and IPOTRO, reporting no pollution for the sampling points near the head of the basin, between 4100 and 2900 m of altitude; however, pollution appears when the river passes through populated areas, reaching valuations from low to very high pollution.
Acknowledgement

The authors would like to thank the Vice-Presidency of Research of the Universidad Nacional José María Arguedas, for the financing and use of the water analysis and control research laboratory.

References

[1] S. A. Abed, S. Hussein, and N. Al-Ansari, “Evaluation of water quality in the Tigris River within Baghdad, Iraq using multivariate statistical techniques,” Journal of Physics: Conference Series, vol. 1294, no. 7, October 2019. [Online]. Available: https://doi.org/10.1088/1742-6596/1294/7/072025

S. A. Abed S. Hussein N. Al-Ansari Evaluation of water quality in the Tigris River within Baghdad, Iraq using multivariate statistical techniquesJournal of Physics: Conference Series129472019https://doi.org/10.1088/1742-6596/1294/7/072025

[2] N. Khatri and S. Tyagi, “Influences of natural and anthropogenic factors on surface and groundwater quality in rural and urban areas,” Frontiers in Life Science, vol. 8, no. 1, 2015. [Online]. Available: https://doi.org/10.1080/21553769.2014.933716

N. Khatri S. Tyagi Influences of natural and anthropogenic factors on surface and groundwater quality in rural and urban areasFrontiers in Life Science812015https://doi.org/10.1080/21553769.2014.933716

[3] H. Hosseini, A. Shakeri, M. Rezaei, M. Dashti, and M. Rastegari, “Water chemistry and water quality pollution indices of heavy metals: A case study of Chahnimeh Water Reservoirs, Southeast of Iran,” International Journal of Energy and Water Resources, vol. 4, October 2020. [Online]. Available: https://doi.org/10.1007/s42108-019-00051-7

H. Hosseini A. Shakeri M. Rezaei M. Dashti M. Rastegari Water chemistry and water quality pollution indices of heavy metals: A case study of Chahnimeh Water Reservoirs, Southeast of IranInternational Journal of Energy and Water Resources42020https://doi.org/10.1007/s42108-019-00051-7

[4] J. A. Haro, G. Nubes, and J. R. Calderón, “Riesgos sanitarios en calidad bacteriológica del agua. Una evaluación en diez estados de la República mexicana,” Región y Sociedad, vol. 24, no. 3, January 2012. [Online]. Available: https://doi.org/10.22198/rys.2012.3.a414

J. A. Haro G. Nubes J. R. Calderón Riesgos sanitarios en calidad bacteriológica del agua. Una evaluación en diez estados de la República mexicanaRegión y Sociedad2432012https://doi.org/10.22198/rys.2012.3.a414

[5] Autoridad Nacional del Agua (ANA), Dirección de Gestión de Calidad de los Recursos Hídricos, “Calidad de agua en cuencas hidrográficas a nivel nacional,” Autoridad Nacional del Agua (ANA), Dirección de Gestión de Calidad de los Recursos Hídricos, Perú, Tech. Rep. 021-2015-ANA-DGCRH-GOCRH, Jun. 2015.

Autoridad Nacional del Agua (ANA) Dirección de Gestión de Calidad de los Recursos Hídricos Calidad de agua en cuencas hidrográficas a nivel nacionalAutoridad Nacional del Agua (ANA), Dirección de Gestión de Calidad de los Recursos HídricosPerú021-2015-ANA-DGCRH-GOCRH2015

[6] D. Choque, C. A. Ligarda, B. S. Ramos, A. M. Solano, and Y. Quispe, “Cafeína y barrido UV-Vis y el índice de calidad de agua en la microcuenca altoandina del río Chumbao, Andahuaylas, Apurímac, Perú,” Tecnología Química, vol. 39, no. 3, pp. 619-637, Sep. 2019.

D. Choque C. A. Ligarda B. S. Ramos A. M. Solano Y. Quispe Cafeína y barrido UV-Vis y el índice de calidad de agua en la microcuenca altoandina del río Chumbao, Andahuaylas, Apurímac, PerúTecnología Química3936196372019

[7] A. M. Abdel, M. H. Ali, and M. E. Goher, “Indices of water quality and metal pollution of Nile River, Egypt,” The Egyptian Journal of Aquatic Research, vol. 43, no. 1, March 2017. [Online]. Available: https://doi.org/10.1016/j.ejar.2016.12.006

A. M. Abdel M. H. Ali M. E. Goher Indices of water quality and metal pollution of Nile River, EgyptThe Egyptian Journal of Aquatic Research4312017https://doi.org/10.1016/j.ejar.2016.12.006

[8] World Health Organization (WHO), Guidelines for drinking water quality, 3rd ed. Geneva, CH: World Health Organization (WHO), 2006.

World Health Organization (WHO) Guidelines for drinking water quality3Geneva, CHWorld Health Organization (WHO)2006

[9] Ministerio del Ambiente (MINAM). (2017, Jun. 7) Estándares de calidad ambiental (eca) para agua y establecen disposiciones complementarias. [Online]. Available: https://bit.ly/3n9h1HA

Ministerio del Ambiente (MINAM) 2017Estándares de calidad ambiental (eca) para agua y establecen disposiciones complementariashttps://bit.ly/3n9h1HA

[10] R. K. Horton, “An index-number system for rating water quality,” Water Pollu. Cont. Fed., vol. 37, no. 3, pp. 300-306, 1965.

R. K. Horton An index-number system for rating water qualityWater Pollu. Cont. Fed.3733003061965

[11] R. M. Brown, N. I. McClelland, R. A. Deininger, and R. Tozer, “A water quality index do we dare?” Water & Sewage Works, vol. 11, pp. 339-343, Oct. 1970.

R. M. Brown N. I. McClelland R. A. Deininger R. Tozer A water quality index do we dare?Water & Sewage Works113393431970

[12] R. Seth and et al, “Application of technique in the assessment of ground water quality of Udham Singh Nagar UIttarakhand,” Water Quality Exposure and Health, vol. 6, no. 4, June 2014. [Online]. Available: https://doi.org/10.1007/s12403-014-0127-5

R. Seth Application of technique in the assessment of ground water quality of Udham Singh Nagar UIttarakhandWater Quality Exposure and Health642014https://doi.org/10.1007/s12403-014-0127-5

[13] S. H. Dinius, “Design of an index of water quality,” Water Resources Bulletin, vol. 23, no. 5, October 1987. [Online]. Available: https://doi.org/10.1111/j.1752-1688.1987.tb02959.x

S. H. Dinius Design of an index of water qualityWater Resources Bulletin2351987https://doi.org/10.1111/j.1752-1688.1987.tb02959.x

[14] A. Ramírez, R. Restrepo, and G. Viña, “Cuatro índices de contaminación para caracterización de aguas continentales. Formulaciones y aplicación,” Ciencia Tecnología y Futuro, vol. 1, no. 3, pp. 135-153, Jan. 1997.

A. Ramírez R. Restrepo G. Viña Cuatro índices de contaminación para caracterización de aguas continentales. Formulaciones y aplicaciónCiencia Tecnología y Futuro131351531997

[15] A. Ramírez , R. Restrepo , and M. Cardeñosa, “Índices de contaminación para caracterización de aguas continentales y vertimientos. Formulaciones,” Ciencia Tecnología y Futuro , vol. 1, no. 5, pp. 89-99, Jan. 1999.

A. Ramírez R. Restrepo M. Cardeñosa Índices de contaminación para caracterización de aguas continentales y vertimientos. FormulacionesCiencia Tecnología y Futuro1589991999

[16] S. I. Mohammed and K. A. Abdulrazzaq, “Developing water quality index to assess the quality of the drinking water,” Civil Engineering Journal, vol. 4, no. 10, October 2018. [Online]. Available: https://doi.org/10.28991/cej-03091164

S. I. Mohammed K. A. Abdulrazzaq Developing water quality index to assess the quality of the drinking waterCivil Engineering Journal4102018https://doi.org/10.28991/cej-03091164

[17] A. R. M. de Oliveira, A. Borges, A. Matos, and M. Nascimento, “Estimation on the concentration of suspended solids from turbidity in the water of two sub-basins in the doce river basin,” Engenharia Agrícola, vol. 38, no. 5, September 2018. [Online]. Available: http://dx.doi.org/10.1590/1809-4430-eng.agric.v38n5p751-759/2018

A. R. M. de Oliveira A. Borges A. Matos M. Nascimento Estimation on the concentration of suspended solids from turbidity in the water of two sub-basins in the doce river basinEngenharia Agrícola3852018http://dx.doi.org/10.1590/1809-4430-eng.agric.v38n5p751-759/2018

[18] S. O. Hamad, “Develop and apply water quality index to evaluate water quality of tigris and euphrates rivers in Iraq,” International Journal of Modern Engineering Research, vol. 3, no. 4, pp. 2119-2126, Aug. 2013.

S. O. Hamad Develop and apply water quality index to evaluate water quality of tigris and euphrates rivers in IraqInternational Journal of Modern Engineering Research34211921262013

[19] J. V. Loperfido, C. L. Just, A. N. Papanicolaou, and J. L. Schnoor, “In situ sesing to understand diel turbidity cycles, suspended solids, and nutrient transport in Clear Creek, Iowa,” Water Resources Research, vol. 46, no. 6, June 30 2010. [Online]. Available: https://doi.org/10.1029/2009WR008293

J. V. Loperfido C. L. Just A. N. Papanicolaou J. L. Schnoor In situ sesing to understand diel turbidity cycles, suspended solids, and nutrient transport in Clear Creek, IowaWater Resources Research4662010https://doi.org/10.1029/2009WR008293

[20] K. K. Singh, G. Tewari, and S. Kumar, “Evaluation of groundwater quality for suitability of irrigation purposes: A case study in the Udham Singh Nagar, Uttarakhand,” Journal of Chemistry, vol. 2020, no. 2, March 2020. [Online]. Available: https://doi.org/10.1155/2020/6924026

K. K. Singh G. Tewari S. Kumar Evaluation of groundwater quality for suitability of irrigation purposes: A case study in the Udham Singh Nagar, UttarakhandJournal of Chemistry202022020https://doi.org/10.1155/2020/6924026

[21] J. Rodríguez, “Parámetros fisicoquímicos de dureza total en calcio y magnesio, pH, conductividad y temperatura del agua potable analizados en conjunto con las Asociaciones Administradoras del Acueducto, (ASADAS), de cada distrito de Grecia, cantón de Alajuela,” Revista Pensamiento Actual, vol. 9, no. 12-13, pp. 125-134, 2009.

J. Rodríguez Parámetros fisicoquímicos de dureza total en calcio y magnesio, pH, conductividad y temperatura del agua potable analizados en conjunto con las Asociaciones Administradoras del Acueducto, (ASADAS), de cada distrito de Grecia, cantón de AlajuelaRevista Pensamiento Actual912-131251342009

[22] T. M. Espinosa and C. Rodríguez, “Tech note: Determination of water quality index (WQI) of Morón river and Patanemo river of Carabobo state in Venezuela,” Revista INGENIERÍA UC, vol. 23, no. 2, pp. 204-215, aug 2016.

T. M. Espinosa C. Rodríguez Tech note: Determination of water quality index (WQI) of Morón river and Patanemo river of Carabobo state in VenezuelaRevista INGENIERÍA UC2322042152016

[23] A. M. Aveiga, P. Noles, A de la Cruz, F. Peñarrieta, and F. Alcántara, “Variaciones físico-químicas de la calidad del agua del río Carrizal en Manabí,” Enfoque UTE, vol. 10, no. 3, September 30 2019. [Online]. Available: https://doi.org/10.29019/enfoque.v10n3.423

A. M. Aveiga P. Noles A de la Cruz F. Peñarrieta F. Alcántara Variaciones físico-químicas de la calidad del agua del río Carrizal en ManabíEnfoque UTE1032019https://doi.org/10.29019/enfoque.v10n3.423

[24] A. M. Abdel , “Water quality assessment of river Nile from Idfo to Cairo,” Egyptian Journal of Aquatic Research, vol. 31, no. 2, pp. 200-223, jan 2005.

A. M. Abdel Water quality assessment of river Nile from Idfo to CairoEgyptian Journal of Aquatic Research3122002232005

[25] A. A. Oketola, S. M. Adekolurejo, and O. Osibanjo, “Water quality assessment of river ogun using multivariate statistical techniques,” Journal of Environmental Protection, vol. 4, no. 5, May 2013. [Online]. Available: https://doi.org/10.4236/jep.2013.45055

A. A. OketolaS. M. Adekolurejo O. Osibanjo Water quality assessment of river ogun using multivariate statistical techniquesJournal of Environmental Protection452013https://doi.org/10.4236/jep.2013.45055

[26] Autoridad Nacional del Agua (ANA) and Ministerio de Agricultura y Riego, “Protocolo nacional para el monitoreo de calidad de los recursos hidricos superficiales,” Autoridad Nacional del Agua (ANA), Ministerio de Agricultura y Riego, Perú, Tech. Rep. 010-2016-ANA, 2016.

Autoridad Nacional del Agua Ministerio de Agricultura y Riego Protocolo nacional para el monitoreo de calidad de los recursos hidricos superficialesAutoridad Nacional del Agua (ANA), Ministerio de Agricultura y RiegoPerú010-2016-ANA2016

[27] Laura Bridgewater, American Public Health Association, American Water Works Association, Water Environment Federation, Standard methods for the examination of water and wastewater, 22nd ed. Washington, USA: American Public Health Association, 2012.

Laura Bridgewater American Public Health Association American Water Works Association Water Environment Federation Standard methods for the examination of water and wastewater22Washington, USAAmerican Public Health Association2012

[28] C. I. Rodriguez, C. Duque, M. L. Calvache, and M. López, “Causas de las variaciones de la conductividad eléctrica del agua subterránea en el acuífero Motril-Salobreña, España,” Geogaceta, vol. 49, pp. 107-110, 2010.

C. I. Rodriguez C. Duque M. L. Calvache M. López Causas de las variaciones de la conductividad eléctrica del agua subterránea en el acuífero Motril-Salobreña, EspañaGeogaceta491071102010

[29] M. N. Uddin, M. S. Alam, M. N. Mobin, and M. A. Miah, “An assessment of the river water quality parameters: A case of Jamuna River,” J. Environ. Sci. & Natural Resources, vol. 7, no. 1, 2014. [Online]. Available: https://doi.org/10.3329/jesnr.v7i1.22179

M. N. Uddin M. S. Alam M. N. Mobin M. A. Miah An assessment of the river water quality parameters: A case of Jamuna RiverJ. Environ. Sci. & Natural Resources712014https://doi.org/10.3329/jesnr.v7i1.22179

[30] O. A. Gamarra and et al, “Fuentes de contaminación estacionales en la cuenca del río Utcubamba, región Amazonas, Perú,” Arnaldoa, vol. 25, no. 1, Jan 2018. [Online]. Available: http://doi.org/10.22497/arnaldoa.251.25111

O. A. Gamarra Fuentes de contaminación estacionales en la cuenca del río Utcubamba, región Amazonas, PerúArnaldoa2512018http://doi.org/10.22497/arnaldoa.251.25111

[31] K. Mei and et al, “Evaluation of spatial-temporal variations and trends in surface water quality across a rural-suburban-urban interface,” Environmental Science and Pollution Research, vol. 21, no. 13, March 25 2014. [Online]. Available: http://dx.doi.org/http://doi.org/10.1007/s11356-014-2716-z

K. Mei Evaluation of spatial-temporal variations and trends in surface water quality across a rural-suburban-urban interfaceEnvironmental Science and Pollution Research21132014http://dx.doi.org/http://doi.org/10.1007/s11356-014-2716-z

[32] D. Pullanikkatil, L. G. Palamuleni, and T. M. Ruhiiga, “Impact of land use on water quality in the Likangala catchment, southern Malawi,” African Journal of Aquatic Science, vol. 40, no. 3, September 2015. [Online]. Available: https://doi.org/10.2989/16085914.2015.1077777

D. Pullanikkatil L. G. Palamuleni T. M. Ruhiiga Impact of land use on water quality in the Likangala catchment, southern MalawiAfrican Journal of Aquatic Science4032015https://doi.org/10.2989/16085914.2015.1077777

[33] A. Kulkarni, “Water quality retrieval from landsat TM imagery,” Procedia Computer Science, vol. 6, December 2011. [Online]. Available: https://doi.org/10.1016/j.procs.2011.08.088

A. Kulkarni Water quality retrieval from landsat TM imageryProcedia Computer Science62011https://doi.org/10.1016/j.procs.2011.08.088

[34] S. Segnini and M. M. Chacón, “Caracterización fisicoquímica del hábitad interno ribereño de ríos andinos en la cordillera de Mérida, Venezuela,” Ecotropicos, vol. 18, no. 1, pp. 38-61, Jan. 2005.

S. Segnini M. M. Chacón Caracterización fisicoquímica del hábitad interno ribereño de ríos andinos en la cordillera de Mérida, VenezuelaEcotropicos18138612005

[35] A. Hannouche and et al, “Relationship between turbidity and total suspended solids concentration within a combined sewer system,” Water Science and Technology, vol. 64, no. 12, December 2011. [Online]. Available: https://doi.org/10.2166/wst.2011.779

A. Hannouche Relationship between turbidity and total suspended solids concentration within a combined sewer systemWater Science and Technology64122011https://doi.org/10.2166/wst.2011.779

[36] F. Guerrero, A. Manjarréz, and N. Núñez, “Los macroinvertebrados bentónicos de Pozo Azul (cuenca del río Gaira, Colombia) y su relación con la calidad del agua,” Acta Biológica Colombiana, vol. 8, no. 2, pp. 43-55, Nov. 2003.

F. Guerrero A. Manjarréz N. Núñez Los macroinvertebrados bentónicos de Pozo Azul (cuenca del río Gaira, Colombia) y su relación con la calidad del aguaActa Biológica Colombiana8243552003

[37] V. Gonzáles, O. Caicedo, and N. Aguirre, “Aplicación de los índices NSF, DINIUS y BMWP para el análisis de la calidad de agua de la Quebrada La Ayurá, Antioquia Colombia,” Gestión y Ambiente, vol. 16, no. 1, pp. 97-107, May 2013.

V. Gonzáles O. Caicedo N. Aguirre Aplicación de los índices NSF, DINIUS y BMWP para el análisis de la calidad de agua de la Quebrada La Ayurá, Antioquia ColombiaGestión y Ambiente161971072013

[38] M. A. Jiménez and M. V. Vélez, “Análisis comparativo de indicadores de la calidad del agua superficial,” Revista Avances en recursos hidráulicos, no. 14, pp. 53-69, Oct. 2006.

M. A. Jiménez M. V. Vélez Análisis comparativo de indicadores de la calidad del agua superficialRevista Avances en recursos hidráulicos1453692006

[39] C. A. Benjumea, “Determinación de coeficientes de degradación de materia orgánica en el río Negro (municipio de Rionegro, Colombia),” Revista Bionatura, vol. 3, no. 1, February 2018. [Online]. Available: http://dx.doi.org/10.21931/RB/2018.03.01.10

C. A. Benjumea Determinación de coeficientes de degradación de materia orgánica en el río Negro (municipio de Rionegro, Colombia)Revista Bionatura312018http://dx.doi.org/10.21931/RB/2018.03.01.10

[40] Z. R. Staley, V. J. Harwood, and J. R. Rohr, “A synthesis of the effects of pesticides on microbial persistence in aquatic ecosystems,” Critical reviews in toxicology, vol. 45, no. 10, November 13 2015. [Online]. Available: http://dx.doi.org/10.3109/10408444.2015.1065471

Z. R. Staley V. J. Harwood J. R. Rohr A synthesis of the effects of pesticides on microbial persistence in aquatic ecosystemsCritical reviews in toxicology45102015http://dx.doi.org/10.3109/10408444.2015.1065471

[41] E. J. Muturi, R. Donthu, C. J. Fields, I. K. Moise, , and C. Kim, “Effect of pesticides on microbial communities in container aquatic habitats,” Scientific reports, vol. 7, no. 44565, March 2017. [Online]. Available: http://dx.doi.org/10.1038/srep44565

E. J. Muturi R. Donthu C. J. Fields I. K. Moise C. Kim Effect of pesticides on microbial communities in container aquatic habitatsScientific reports7445652017http://dx.doi.org/10.1038/srep44565

[42] M. Olson, M. Hage, M. D. Binkley, and J. Binder, “Impact of migratory snow geese on nitrogen and phosphorus dynamics in a freshwater reservoir,” Freshwater Biology, vol. 50, no. 5, May 2005. [Online]. Available: https://doi.org/10.1111/j.1365-2427.2005.01367.x

M. Olson M. Hage M. D. Binkley J. Binder Impact of migratory snow geese on nitrogen and phosphorus dynamics in a freshwater reservoirFreshwater Biology5052005https://doi.org/10.1111/j.1365-2427.2005.01367.x

[43] E. Boros and et al, “The effect of aquatic birds on the nutrient load and water quality of soda pans in Hungary,” Acta Zoologica Academiae Scientiarum Hungaricae, vol. 54, Suppl. 1, pp. 207-224, Jan. 2008.

E. Boros The effect of aquatic birds on the nutrient load and water quality of soda pans in HungaryActa Zoologica Academiae Scientiarum Hungaricae5412072242008

[44] Y. Montoya, Y. Acosta, and E. Zuluaga, “Evaluación de la calidad del agua en el río negro y sus principales tributarios empleandocomo indicadores de indices ica, el bmwp/col y aspt,” Caldasia, vol. 33, no. 1, pp. 193-210, Apr. 2013.

Y. Montoya Y. Acosta E. Zuluaga Evaluación de la calidad del agua en el río negro y sus principales tributarios empleandocomo indicadores de indices ica, el bmwp/col y asptCaldasia3311932102013

[45] J. A. Larrea, M. M. Rojas, B. Romeu, N. M. Rojas, and M. Heydrich, “Bacterias indicadoras de contaminación fecal en la evaluación de la calidad de las aguas,” Revista Centro Nacional de Investigaciones Científicas Cuba, vol. 44, no. 3, pp. 24-34, Oct. 2013.

J. A. Larrea M. M. Rojas B. Romeu N. M. Rojas M. Heydrich Bacterias indicadoras de contaminación fecal en la evaluación de la calidad de las aguasRevista Centro Nacional de Investigaciones Científicas Cuba44324342013

[46] C. L. Fernández and G. Barrera, “Comparación de técnicas para la extracción de bacterias coliformes del sedimento del lago de Xochimilco, México,” Revista Argentina de Microbiología, vol. 45, no. 3, July 2013. [Online]. Available: https://doi.org/10.1016/S0325-7541(13)70022-1

C. L. Fernández G. Barrera Comparación de técnicas para la extracción de bacterias coliformes del sedimento del lago de Xochimilco, MéxicoRevista Argentina de Microbiología4532013https://doi.org/10.1016/S0325-7541(13)70022-1

[47] T. Gomi, R. D. Moore, and M. A. Hassan, “Suspended sediment dynamics in small forest streams of the Pacific Northwest,” Journal of Americ and Water Resources Association, vol. 41, no. 4, August 2005. [Online]. Available: https://doi.org/10.1111/j.1752-1688.2005.tb03775.x

T. Gomi R. D. Moore M. A. Hassan Suspended sediment dynamics in small forest streams of the Pacific NorthwestJournal of Americ and Water Resources Association4142005https://doi.org/10.1111/j.1752-1688.2005.tb03775.x

[48] Z. W. Leibowitz, L. A. Fortes, P. V. De Lima, E. M. Eskinazi, and N. Oliveira, “Significant changes in water pCO2 caused by turbulence from waterfalls,” Limnologica, vol. 62, January 2017. [Online]. Available: https://doi.org/10.1016/j.limno.2016.09.008

Z. W. Leibowitz L. A. Fortes P. V. De Lima E. M. Eskinazi N. Oliveira Significant changes in water pCO2 caused by turbulence from waterfallsLimnologica622017https://doi.org/10.1016/j.limno.2016.09.008

[49] N. Bustamante, N. Danoucaras, N. Mclntyre, J. C. Díaz, and O. J. Restrepo, “Review of improving the water management for the informal gold mining in Colombia,” Revista Facultad de Ingeniería Universidad de Antioquia, no. 79, April 2016. [Online]. Available: https://doi.org/10.17533/udea.redin.n79a16

N. Bustamante N. Danoucaras N. Mclntyre J. C. DíazO. J. RestrepoReview of improving the water management for the informal gold mining in ColombiaRevista Facultad de Ingeniería Universidad de Antioquia792016https://doi.org/10.17533/udea.redin.n79a16

[4]Data availability statement: The authors confirm that the data supporting the findings of this study are available within the article [and/or] its supplementary materials.

[5]CITETHIS ARTICLE AS: D. Choque-Quispe, B. S. Ramos-Pacheco, C. A. Ligarda-Samanez, A. M. Solano-Reynoso, O. Correa-Cuba, Y. Quispe-Quispeand, Y. Choque-Quispe. Waterpollution index of high Andeanmicro-basin of the ChumbaoRiver, Andahuaylas, Peru,Revista Facultad de Ingeniería Universidad de Antioquia, no. 105, pp. 20-28, Oct-Dec 2022. [Online]. Available: https://www.doi.org/10.17533/udea.redin.20210533

[6] Financial disclosure This work was supported by Universidad Nacional José María Arguedas, for the financing and use of the wáter analysis and control research laboratory.