1. Introduction
Traditional treatments against neurological diseases, cancer and other localized pathologies might induce undesirable side effects, mainly because drugs reach not only diseased but healthy tissues [1]. For this reason, scientists have invested much effort toward the development of new alternatives to target specific regions within affected tissues upon the localized delivery of the therapeutic molecules [2].
Over the past few years, a popular alternative has emerged to overcome these issues that relies on the delivery of therapeutic agents directly conjugated on the surface of nanoscale vehicles such as nanoparticles [3-5]. The main advantage of such strategy is the availability of relatively simple chemical pathways to accomplish conjugation [6]. Additionally, nanoparticles offer large surface-to-volume ratios, and exhibit sizes similar to those of various biological molecules including antibodies, receptors and nucleic acids [7]. Consequently, nanoparticles are well suited to pass through highly-selective biological membranes such as the blood-brain barrier (BBB) [8, 9], which consists of tight junctions that confer selectivity toward water, some gases and lipid-soluble molecules [10, 11].
Accordingly, nanoparticle-based therapies have gained considerable attention as potential candidates to develop robust treatments for conditions such as Parkinson’s or Alzheimer’s [5, 12]. In spite of the advantages of nanoparticles, and due to economical and ethical barriers, in vitro and in vivo experimentation is often constrained. This has considerably limited the clinical adoption of nanoparticle-based therapies [13].
Computational modeling is a robust approach to overcome these issues as it allows accurate simulation of physical and chemical phenomena in silico. The finite element analysis (FEA) can be used to support the research in nanomedicine field [14]. Comsol Multiphysics® is a simulation package that relies on the Finite Element Method (FEM) to solve systems of partial differential equations that model physical and chemical phenomena occurring simultaneously.
This work aims at simulating and experimentally validating steady-state water flow through a fluidic device with dimensions and topology similar to those found in small arteries. Simulation was implemented in Comsol Multiphysics®. Our results showed a good agreement between simulations and experimental measurements. Obtained fluid flow velocity profiles approached those observed for blood in small arteries. We expect to employ the device to determine whether the transport of therapeutics conjugated to magnetic nanoparticles can be preferentially guided by arrays of permanent magnets in vascular systems.
1.1 Incompressible newtonian fluid flow governing equations
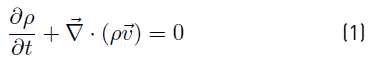
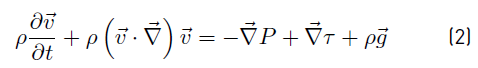
Mass conservation (continuity Equation) (1) and conservation of linear momentum (2) are used to model the macroscopic fluid flow phenomena. Where ρ is the fluid density, v is the velocity field, P is the pressure, g is the gravity and 𝝉 is the viscous stress tensor [15].
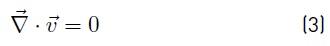
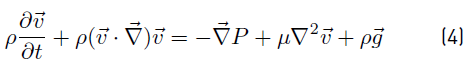
When Newtonian fluid flow is considered, viscous stress tensor τ can be written in terms of dynamic viscosity µ and velocity gradients. If in addition the flow is incompressible, density ρ is constant and uniform. Accordingly, for incompressible Newtonian fluid flow, Equations (1) and (2) are reduced to Equations (3) and (4) respectively. 3D equations involved in (4) are known as the Navier-Stokes equations [15].
2. Methodology
A computational model was implemented to have a virtual platform for the stationary water flow through a fluidic device mimicking small arteries.
Restrictions for the model were imposed by considering experimental limitations of the available instrumentation. In this regard, the fluidic system was equipped with Elveflow OB1 MK3 Pressure Controller and Flow Sensor. Figure 1 shows the experimental implementation, where Elveflow software and OB1 MK3 (1) allows controlling the pressure at the top of closed 15mL Falcon fluid reservoir (2), and the contained fluid is pressurized from the reservoir bottom through a 0.8mm inner diameter tube to Elveflow flow sensor (3) and fluidic device (4) until reaches a waste reservoir (5). Fluid injection pressure is then the sum of controlled pressure and partial pressures exerted by air and fluid contained in the falcon tube. The sole measurable variable was flow rate between 0mL/min and 5mL/min, using Elveflow Flow Sensor.
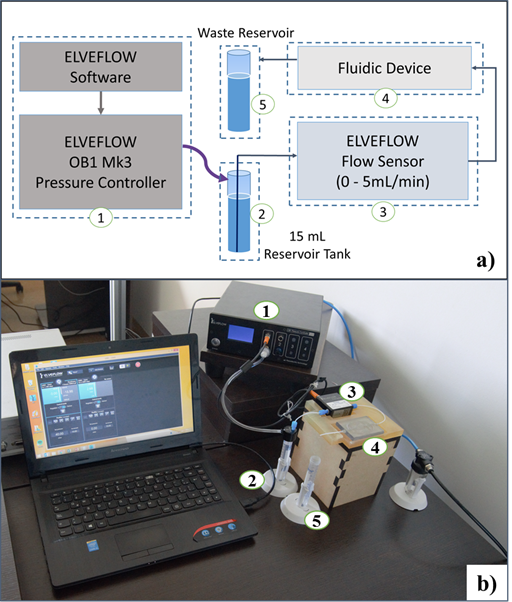
Accordingly, the implemented computational model included water flow through the microtube from the bottom of the tank (2) which corresponds to system inlet, and forward passing through flow sensor (3) and fluidic device mimicking a section of small arteries (4) as shown for experiment implementation in Figure 1. At the device outlet, a portion of a 0.8mm diameter microtube is connected with an open end at atmospheric pressure (system outlet), dropping to a reservoir (5). Computational and experimental flow rates at different fluid injection pressures were compared in order to validate the model.
2.1 Modeling and simulation
FEM-based modeling and simulations was implemented in Comsol Multiphysics® 5.3. The simulations were run in a 8Gb RAM, 8 cores CPU Devian server.
Computational domain
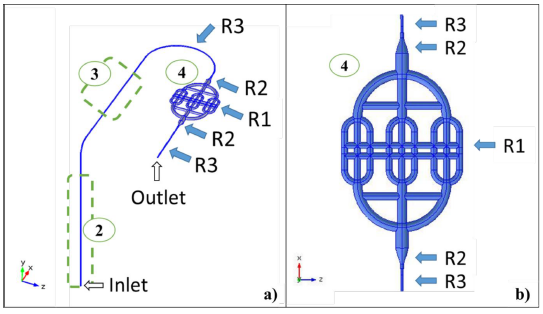
Figure 2 shows the coordinate system and the computational domain, which was composed by three regions. Region 1 (R1) corresponds to the fluidic device with circular cross section channels that varied from 2 to 4 mm in diameter. Region 3 (R3) includes 0.8mm inner diameter tubing and a flow sensor with the same diameter. Region 2 (R2) is a fitting to connect R1 and R3.
Governing equations, boundary conditions, material properties and initial values
Governing equations for incompressible Newtonian fluid flow, (3) and (4), were implemented in Comsol Multiphysics® by using the Single-Phase Laminar Flow interface, which is incorporated in the CFD module. Gravity volume force (ρg) direction is considered to be in negative Y-axis. Inlet boundary condition was set each trial at 20mbar, 30mbar, 40mbar, and 50mbar. Outlet boundary was set at atmospheric pressure and the nonslip condition (v=0) was defined for the other boundaries. Water density was 998.2 Kg/m3 (T=291.15K) and initial velocity values were zero.
Mesh convergence analysis and solver
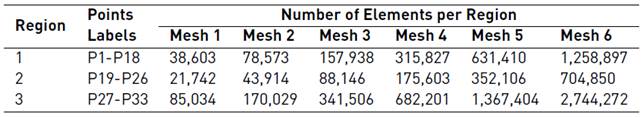
Mesh convergence analyses were conducted over six duplicating free tetrahedral meshes per region. The evaluated variable was the velocity magnitude at different locations along the domain for 20mbar and 50mbar inlet pressures. Table 1 summarizes the number of elements in meshes used per region for mesh convergence analysis. The convergence criterion was that upon duplicating the number of elements in a region (while keeping constant this number in other regions), the velocity magnitude at each location remained within 2% of the previous value.
The number of locations per region were 18 for R1 (P1-P18), 8 for R2 (P19-P26) and 7 for R3 (P27-P33). The study was conducted under steady-state conditions and therefore, a stationary study was set up using the PARDISO direct solver, which is a high-performance, robust and memory efficient direct method for solving large sparse symmetric and unsymmetrical linear systems of equations on shared-memory and distributed-memory multiprocessors.
Model simplification: replacing R3 with boundary conditions
To reduce the computational time, a simplified model was implemented such that only R1 and R2 were simulated. For R3, laminar flow conditions at the device inlet and outlet were assumed. At the inlet, a laminar flow rate was set as the value given for flow rate in the equivalent complete model. At the outlet, a zero pressure laminar flow was set, which corresponds to the tubing connected to the device outlet (4 cm in length).
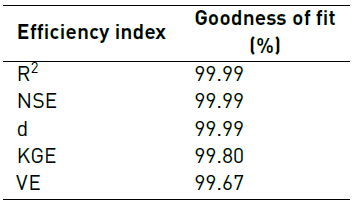
Additionaly, velocity magnitude values at 20 different locations inside the fluidic device were compared for both the complete and simplified model to check their level of agreement. This was accomplished via goodness of fit analyses by calculating coefficient of determination (R2), Nash-Sutcliffe Efficiency (NSE), Index of Agreement (d), Kling-Gupta Efficiency (KGE) and Volumetric Efficiency (VE).
All indexes were estimated using the ‘hydroGOF’ package, which is incorporated in the statistics software R. The statistical goodness-of-fit implemented here has been widely used for calibration and validation of hydrological models [16, 17]. All indexes take values between 0 and 1, where 1 represents 100% agreement between the model and the data obtained experimentally.
2.2 Experimental Setup
Figure 1 shows a schematic of the experimental setup to validate the CFD simulations. The fluidic device was 3D printed using Object30 prime printer at a resolution of 4µm. The manufacturing material was Med610. Channels were obtained by removing the material inside them with the aid of both mechanical and chemical methods. The formed channels were rigid and showed no compliance, which was sufficient for the purposes of our study where the main interest was to model and evaluate an average situation. 3D printing was implemented here as the manufacturing method due to the availability of resources and the inexpensiveness of this approach for the required dimensions. The 3D printed device was mounted on a box to assure that in vitro conditions were close to those considered in silico. The Elveflow Software® was used to pressurize the 15mL Falcon reservoir between 0 and 2bar. Water from the reservoir was then pumped through tubing (0.8mm inner diameter) from the bottom of the Falcon. Pressure inside the reservoir equaled the sum of set up pressure and pressures exerted by air and water. Tubing conducting water was then glued to a flat surface where is connected to the Elveflow Flow Sensor® and then to the fluidic device, using also 3D printed fittings (R3 in simulations). Finally, water reached an atmospheric pressure outlet through a 4cm length tubing section. The flow rate was monitored with the Elveflow Flow Sensor®.
The experiment was initiated by priming the entire system with water and by releasing air bubbles. Pressure at the bottom of Falcon was adjusted to 14mbar because with this condition flow approached zero. This was imposed to the simulations as well.
Inlet pressure (at the bottom of Falcon tube) was then changed from 20mbar to 50mbar. For each inlet pressure studied, average flow rates were determined by sampling at a rate of 100 Hz and for a time lapse while the inlet pressure is at the desired level.
Model validation
The experimental average flow rate values were directly compared with those estimated via simulation. Goodness of fit analysis was conducted by calculating the same indexes to compare the simplified and complete models. To assure complete model validation at least two of the indexes above should exceed 95%. Likewise, individual relative errors should be less than 10%.
Linear regressions of simulated and measured values
Simulated and measured average flow rates were fitted to linear regressions in Excel® for each of the studied pressures. Same approach was applied for the average velocity magnitude at the device inlet. The correlations were useful to make predictions on pressure and velocity.
3. Results
3.1 mesh convergence analysis
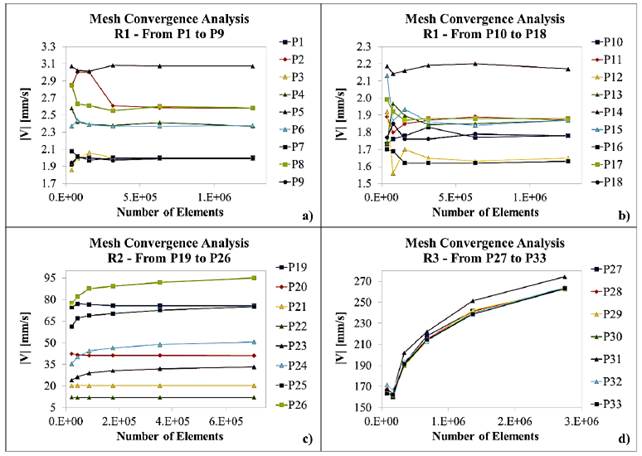
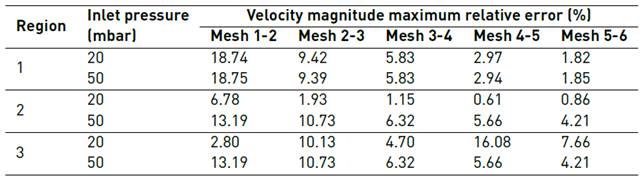
Figures 3 and 4 show the results for mesh convergence per Region at 20mbar and 50mbar inlet pressures, respectively. Table 2 presents maximum relative error for average velocity magnitude values after duplicating mesh size as a function of Region and inlet pressure.
Figure 3
Mesh convergence analysis for 20mbar inlet pressure at Region 1 (a) and (b), Region 2 (c) and Region 3 (d)
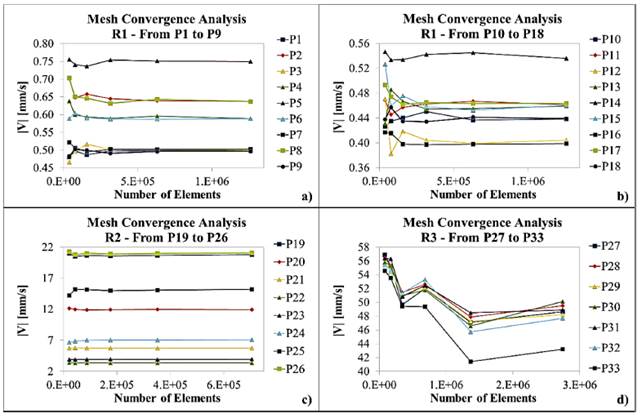
Figure 4
Mesh convergence analysis for 50mbar inlet pressure at Region 1 (a) and (b), Region 2 (c) and Region 3 (d)
3.2 model simplification
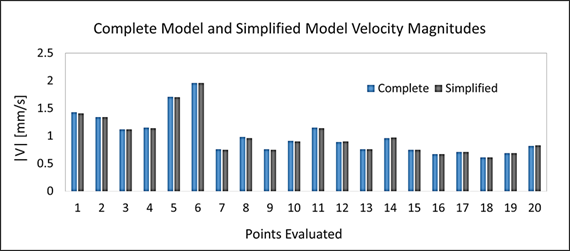
Figure 5 compares velocity magnitudes for the complete and simplified models at 20 different locations. Table 3 presents goodness of fit indexes for the comparison between the simplified and complete models.
3.3 Fine mesh CFD simulation
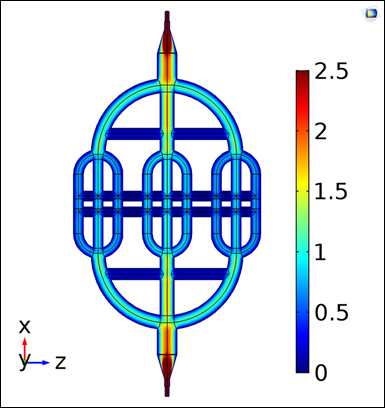
Figure 6 shows the simulated velocity profile in the fluidic device (R1) at 20mbar inlet pressure for the simplified model. This profile was obtained with the best mesh according to the convergence analyses (Mesh 5 for R1 and R2 and Mesh 6 for R3).
3.4 model validation
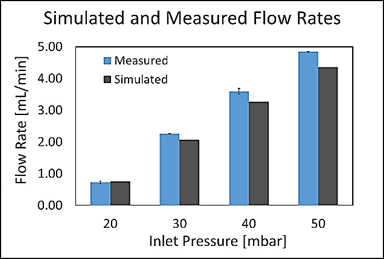
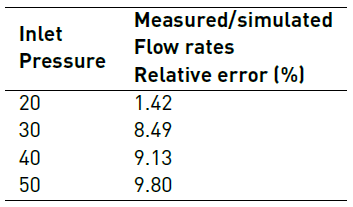
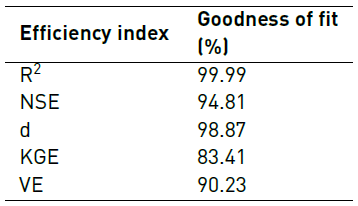
Figure 7 shows the comparison of measured and simulated flow rates at different inlet pressures. Table 4 shows relative errors between measured and simulated flow rates for the evaluated inlet pressures. Table 5 presents goodness of fit indexes between simulated and measured flow rates.
3.5 Linear regressions of simulated and measured values
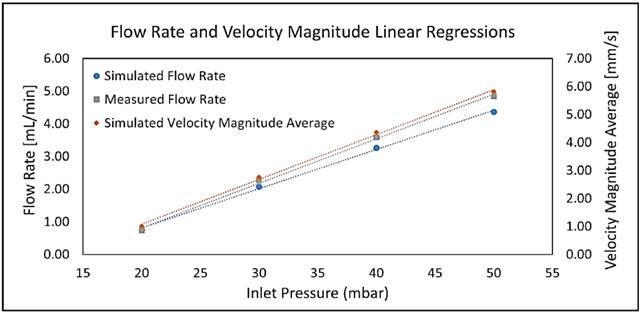
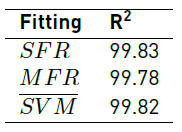
Linear fittings for simulated and measured values for both flow rates and average velocity magnitudes are shown in Figure 8. Equations (5), (6) and (7) represent the linear regression equations for simulated flow rate (SFR) in mL/min, measured flow rate (MFR) in mL/min and simulated velocity magnitude average (SVM) in mm/s, respectively as a function of inlet pressure (P inlet ) in mbar. Table 6 presents the coefficients of determination (R2) of linear fittings.


Figure 8
Linear fittings for simulated and measured flow rates and simulated average velocity magnitudes at the fluidic device inlet as a function of inlet pressure
4. Discussion
As graphically evidenced in Figure 3 and Figure 4, simulated velocity magnitudes tend to converge as the number of elements increases. Nevertheless, this situation is clear just for R1 and R2. By contrast, mesh convergence analysis for R3 (plots d) suggests that, in this case, a higher number of elements is required to ensure a reliable model.
The observed graphical trends are confirmed by data presented in Table 2, where maximum relative error for both 20mbar and 50mbar inlet pressures decreases with an increase in the number of elements for R1 and R2. In the case of R3, maximum relative error varies randomly for the studied mesh sizes, suggesting that convergence is yet to be achieved. These results could be rationalized by the higher Reynolds number observed in R3 compared with R1. This in turn can be attributed to the dimensions of channels at each Region where the Reynolds number increases with increasing inlet pressures and flow rates. As the Reynolds number increases, fluid flow approaches a turbulent regime and consequently the number of elements required for convergence is significantly higher.
As shown in Table 2, convergence was achieved with Mesh 5 in R1 for the studied inlet pressures and in R2 at 20mbar inlet pressure. By contrast, for R2 the maximum relative error obtained with Mesh 5 at 50mbar inlet pressure was 4.21%, which failed to comply with the convergence criteria. This was also the case of R3 where the maximum relative obtained with Mesh 5 were 7.66% and 10.46% for 20mbar and 50mbar inlet pressures, respectively. This suggested that more elements were required to improve convergence and especially for Region 3. Unfortunately, our computational resources limited the implementation of simulations with larger mesh sizes; additionally, a laminar flow regime was assumed valid. According to mesh convergence criteria, Mesh 5 was chosen for R1 while Mesh 6 was selected for R2 and R3.
The comparison between velocity magnitude in complete and simplified models showed in Figure 5 confirms a high agreement between both models. This was confirmed by the fact that the maximum relative error was only 1.65% and that model efficiency indexes presented in Table 3 were above 99% in all cases.
Figure 6 shows qualitative evidence that the velocity profile in the fluidic device behaves as expected for a vascular network, i.e., as the diameters of channels (vessels) decrease the velocity magnitude also decreases. Color distribution throughout the device appears uniform, suggesting that R1 discretization was adequate, which is also consistent with mesh convergence results.
Concerning model validation, results presented in Figure 7, Table 4 and Table 5 suggest some discrepancies between CFD model and experiments. As shown in Figure 7 and Table 4, the relative error between simulated and measured flow rate increases as inlet pressure increases. This was most likely attributed to elevated Reynolds numbers, which make simulation unreliable as the large mesh size required is both impractical and unattainable under our current computational resources. Nevertheless, all maximum relative errors presented in Table 4 were less than 10%. Additionally, the majority of model efficiency indexes presented in Table 5 indicated a good agreement between model and experiments with values above 90%. Only the KGE index was below such mark with a value of 83.41%.
As shown in Figure 8, the linear regressions show a strong linear relationship between SFR, MFR and SVM as a function of inlet pressure. This is confirmed by coefficients of determination obtained [Table 6], which are all above 99%. Equations (5) and (6) allowed model calibration, while velocity profile requirements were adjusted using Equation (7).
5. Conclusion
The experimental validation presented here proved to be useful in determining that complex CFD models describing the fluid flow mechanics of pressurized water inside a 3D printed fluidic device are robust enough to accurately represent real situations. This was confirmed with the aid of goodness of fit indexes above 83.41% and linear regressions. As a result, the in silico approach explored here is well suited to help prototyping new devices based on fluid transport inside small arteries for applications in drug delivery and endovascular devices design.
We validated a suitable CFD model and meshing procedure for fluid flow simulation inside small arteries, which could be further exploited for drug delivery studies based on nanocarriers.
Future work includes the design and validation of a model for the guided transport of magnetic nanocarriers in fluidic devices, which requires the simultaneous study of fluid flow mechanics in small arteries and manipulation of magnetic fields with the aid of permanent magnets [18]. This will be the basis for designing highly-targeted therapies for brain diseases via intrathecal or intravenous administration.